↗ OpenReview ↗ NeurIPS Proc. ↗ Chat
TL;DR#
Many real-world decision-making processes involve aggregating individual preferences into a collective decision, which is often implicitly guided by a “social welfare function.” This paper focuses on learning such functions from data, thereby providing insights into the decision-makers’ rationale. A key challenge lies in choosing an appropriate family of social welfare functions that is both expressive and computationally tractable; this work focuses on the widely used family of power mean functions, which includes utilitarian and egalitarian welfare as special cases. Further challenges include handling noisy or incomplete data and dealing with the unknown weights representing the relative importance of different individuals.
This research introduces novel algorithms and theoretical analyses for learning power mean functions from both cardinal (numerical values) and pairwise (comparisons) data under various noise models. It provides polynomial sample complexity bounds and matching lower bounds in several cases, demonstrating that these functions are efficiently learnable. The authors design and evaluate practical algorithms for these learning tasks, demonstrating successful implementation on both simulated and real-world data (food resource allocation). Their results highlight the impact of noise level and the number of individuals on sample complexity, validating theoretical analysis and showing the feasibility of using this approach in practical settings.
Key Takeaways#
Why does it matter?#
This paper is crucial for researchers in social choice theory, machine learning, and AI for its novel theoretical analysis of learning social welfare functions, particularly the weighted power mean family. It bridges these fields by providing rigorous learnability results and demonstrating practical applications in resource allocation. This opens avenues for further research in designing fair and efficient algorithms using data-driven approaches, especially in settings with noisy or ordinal information.
Visual Insights#

This figure shows the results of experiments conducted for the cardinal case. The x-axis represents the number of samples used in the learning process. The y-axis of the three subplots shows: (a) Test loss, measuring the difference between the predicted and actual social welfare values; (b) KL divergence, quantifying the difference between the learned weight vector and the true weight vector; and (c) Learned p, displaying the learned value of the power mean parameter. Different colored lines represent different levels of added noise (v) to the training data, allowing for an analysis of the algorithm’s robustness to noise. The solid lines represent the performance with learned parameters while dotted lines show the performance if real parameters were used. Overall, the figure demonstrates how the algorithm’s performance improves as the number of samples increases and as the noise level decreases.

This table summarizes the sample complexity results for learning social welfare functions using different types of input data and noise models. The sample complexity represents the number of samples needed to learn the function with a certain level of accuracy. The table shows the complexity for both known and unknown weights, and for cardinal (actual values) and ordinal (pairwise comparisons) social welfare information. Different loss functions (l2, 0-1, and logistic) are considered to reflect different ways of measuring error. The parameters ξ, K, d, ρ, and Tmax are defined in the caption and are used to express the complexity bounds. The table helps to understand the trade-offs between different learning settings in terms of data requirements.
In-depth insights#
Power Mean Learning#
Power Mean Learning presents a novel approach to learning social welfare functions, focusing on the learnability of weighted power mean functions. This family of functions is particularly appealing as it encompasses prominent social welfare functions like utilitarian, egalitarian, and Nash welfare, while also possessing desirable properties for learning. The research tackles two main learning tasks: one using cardinal utility vectors and their corresponding social welfare values, and another using pairwise comparisons of welfare values. Polynomial sample complexity bounds are established for both settings, even with noisy data, demonstrating the efficiency of the approach. Furthermore, the study delves into the impact of different noise models on learning complexity and develops practical algorithms for both learning tasks, showcasing their effectiveness through simulations and real-world data experiments. The development of practical algorithms despite the non-convex nature of the problem is a significant contribution. The analysis of weighted power means is also crucial, providing a flexible framework for analyzing societal preferences.
Noise Model Impact#
The impact of noise models on learning social welfare functions is a crucial aspect of this research. The study acknowledges that real-world decision-making is rarely noise-free; thus, incorporating noise models is essential for practical applicability. The paper investigates two primary noise models: i.i.d noise, where each comparison is independently mislabeled with a known probability, and logistic noise, reflecting the intuition that comparisons are harder when social welfare values are close. The results show a significant effect of noise on sample complexity. I.i.d. noise increases sample complexity proportionally to the noise level, indicating a more substantial impact. Logistic noise, being more nuanced, poses additional challenges, notably requiring the estimation of a noise parameter, which adds to the overall complexity. The findings highlight the need for robust algorithms that can handle various noise scenarios. A key insight is that the impact of noise interacts with the number of individuals and whether or not the weights are known, compounding the challenges and demonstrating the intricate nature of learning social welfare functions in practical settings. The authors’ discussion of these noise models is a valuable contribution toward building more robust and reliable algorithms for social choice.
Algorithm & Data#
A robust ‘Algorithm & Data’ section in a research paper necessitates a meticulous description of both the algorithm’s design and the data employed. Algorithm details should encompass the method’s core logic, including pseudocode or a precise algorithmic description, clarifying any assumptions, and addressing any limitations. The section should then seamlessly transition to a comprehensive data description, specifying the data source, its structure (size, features), and how the data was preprocessed or cleaned. Explicit mention of any biases or limitations inherent to the data, alongside justification for the data selection, is crucial. The interplay between algorithm and data must be explicitly addressed, showing how the algorithm’s design responds to the data’s characteristics and limitations, and vice-versa. Replicability of the presented findings hinges on the transparency of this section, including the version of any software or libraries utilized. Furthermore, acknowledging the potential societal implications of the algorithm is necessary for responsible research practices.
Complexity Bounds#
The section on ‘Complexity Bounds’ would ideally delve into the computational cost of learning social welfare functions, focusing on the sample complexity. This involves determining how many data points (utility vectors and corresponding social welfare judgments or comparisons) are needed to learn the function accurately. Key considerations should include the impact of the number of individuals (d) and the type of social welfare information provided (cardinal or ordinal). For example, the bounds would quantify how the algorithm’s performance scales with increasing ’d’, revealing whether it remains efficient or becomes computationally prohibitive. The analysis should also factor in the presence of noise in the data, specifying how noise affects the required number of samples for accurate learning. Additionally, a rigorous mathematical justification of the derived complexity bounds should be provided, employing techniques such as pseudo-dimension, VC dimension, or Rademacher complexity. The results would highlight the algorithm’s learnability in the presence of noise and the challenges of high dimensionality, offering valuable insights into the feasibility and scalability of the proposed method.
Future Directions#
The “Future Directions” section of this research paper could explore several promising avenues. Extending the theoretical analysis to non-parametric families of social welfare functions would significantly broaden the applicability of the findings beyond the weighted power mean functions. This would require developing new techniques for handling the increased complexity of these function classes. Additionally, investigating the impact of noisy or incomplete utility information is crucial, particularly when utility vectors are estimated, rather than directly observed. Robust learning algorithms that can handle such imperfections would greatly enhance the practical utility of this work. Finally, developing more efficient algorithms for learning, especially in high-dimensional settings, remains a key challenge. This includes exploring alternative optimization strategies, such as those suited for non-convex problems, or developing scalable approximation techniques. Addressing these aspects would significantly strengthen the contributions and pave the way for more impactful applications.
More visual insights#
More on figures

The figure shows the results of the cardinal case experiment with varying sample sizes and different noise levels. It plots the test loss, the Kullback-Leibler (KL) divergence between the true and learned weight vectors, and the learned power mean parameter (p). Solid lines represent the learned parameters, while dotted lines indicate the true parameters. The results demonstrate that, as the number of samples increases and the noise level decreases, the learned parameters converge to the true parameters.

The figure shows the results of the cardinal case experiment with different noise levels (v) and various numbers of samples. The test loss, KL divergence between the true and learned weights, and the learned p are plotted against the number of samples for each noise level. Solid lines represent values for learned parameters, while dotted lines represent values for real parameters. It demonstrates how the algorithm’s performance improves with more samples and less noise. The convergence of the learned parameters towards the true values with increasing sample size is illustrated.

This figure shows the results of experiments conducted for the ordinal case, illustrating how the test loss, KL divergence between true and learned weights, test accuracy on noiseless data, and learned parameter p change with varying numbers of samples and different noise levels (τ). The solid lines represent the results obtained using the learning algorithm, while the dotted lines indicate the true parameter values. This visualization helps in understanding the algorithm’s performance and convergence behavior under different noise conditions and sample sizes.

The figure shows the results of the ordinal case for p=1.62, showing how the test loss, KL divergence, test accuracy, and learned parameter p change with an increasing number of samples and different values of noise level τ. Solid lines represent the values for the learned parameters, while the dotted lines show the values for the real parameters. The results demonstrate that the test loss decreases, KL divergence decreases, and the accuracy increases with an increasing number of samples and decreasing noise. The learned parameter p also becomes closer to the real parameter with a decreasing noise level and an increasing number of samples.

The figure shows that the difference between the log power means of two pairs of utility vectors, (u, v) and (u, v’), is not convex with respect to the power parameter p. This non-convexity can cause gradient-based optimization algorithms to get stuck in local optima, potentially leading to incorrect predictions.

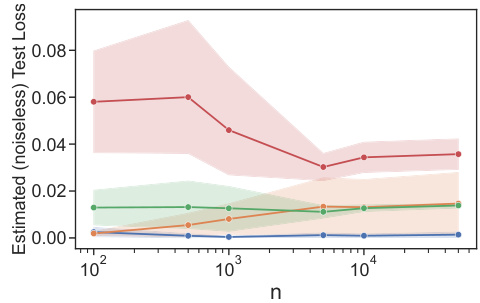
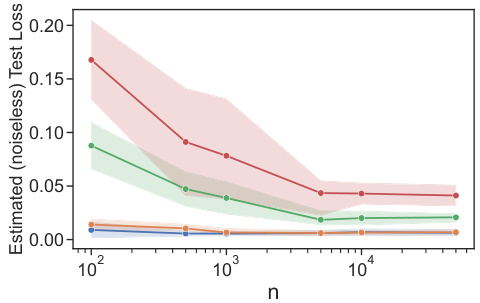
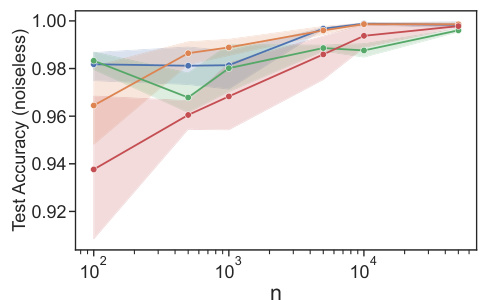
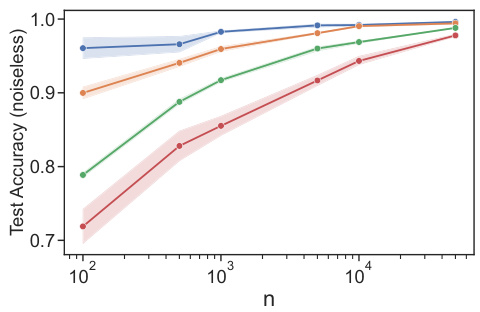
This figure presents the results of experiments conducted on synthetic data for both cardinal and ordinal logistic tasks. It displays the estimated (noiseless) test loss for various settings, illustrating the performance of the proposed algorithm under different conditions. The results show the impact of known versus unknown weights, the number of samples (n), and the dimensionality (d) of the data on the algorithm’s accuracy. The figure allows for a visual comparison of the algorithm’s performance across different experimental setups.

This figure shows the results of experiments conducted on synthetic data for both cardinal and ordinal logistic tasks. It displays the estimated (noiseless) test loss for various settings, including known and unknown weights. The plots show the test loss decreasing with increasing sample size (n), demonstrating the effectiveness of the algorithms in learning the underlying social welfare functions. The impact of dimensionality (d) is also visible, showing higher test loss for the unknown weights case due to the increased complexity of learning more weights.

This figure replots the test accuracy against a rescaled version of the sample size to verify the theoretical sample complexity bound. The alignment of curves suggests that the risk and sample complexity bounds scale as d log d for the ordinal case with logistic noise and unknown weights.

This figure shows the test accuracy on noiseless data against the re-scaled sample size η = √n/(dlog n log d) for different values of d. The alignment of all curves provides evidence that the risk and sample complexity bounds indeed scale as d log n log d for the ordinal case with logistic noise and unknown weights.

This figure shows the test accuracy on noiseless data against the re-scaled sample size, η = √n/(dlog n log d). The alignment of all curves suggests that the risk and sample complexity bounds scale as d log n log d for the ordinal case with logistic noise and unknown weights. The plot verifies the theoretical results by showing how test accuracy increases with sample size for different values of d (number of individuals).
Full paper#


