↗ OpenReview ↗ NeurIPS Proc. ↗ Chat
TL;DR#
Many machine learning interpretability studies quantify the importance of a model component via ablation, which measures the performance drop when a component is disabled. However, existing ablation methods suffer from inconsistent results due to the impact of replacing a component’s value with a counterfactual value during inference. This paper introduces optimal ablation (OA), a new ablation method that selects a constant replacement value that minimizes the expected loss. Unlike existing methods, OA has theoretical guarantees and produces superior empirical results.
OA’s advantages are demonstrated via its applications to several interpretability tasks: circuit discovery, factual recall, and latent prediction. The paper proposes a new algorithm, Uniform Gradient Sampling (UGS), to efficiently discover sparse circuits based on OA. The results show that OA produces circuits that are smaller and lower-loss than those identified by existing methods. Further, OA improves both the predictive power and causal faithfulness of latent prediction. The authors use the Indirect Object Identification subtask and the Greater-Than subtask to demonstrate these improvements.
Key Takeaways#
Why does it matter?#
This paper is highly important for researchers working on model interpretability, especially those focusing on neural networks. Optimal ablation (OA) offers a novel, theoretically-grounded approach to measure component importance, going beyond existing techniques. Its applications in circuit discovery, factual recall, and latent prediction demonstrate the power of OA to improve several key interpretability tasks. The study’s findings may pave the way for better model explanations and further development of interpretability tools. The proposed algorithm, Uniform Gradient Sampling (UGS), provides an efficient means of finding circuits, thus adding value to the field’s methodological toolkit.
Visual Insights#

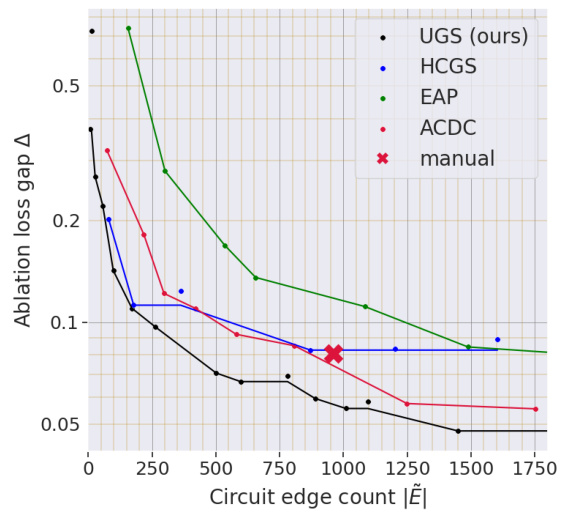
The left panel shows the Pareto frontier for circuit discovery on the Indirect Object Identification (IOI) subtask, using counterfactual ablation. It compares different methods (UGS, HCGS, EAP, ACDC, manual) by plotting ablation loss gap against the number of edges in the circuit. The right panel compares the performance of the same methods on the same task, but using the ablation loss gap as a metric, with the manual circuit also included for comparison. The goal is to show how optimal ablation (OA) and UGS (our proposed method) perform against existing methods in terms of finding smaller and lower-loss circuits.

This table compares the ablation loss gap (Δ) for different ablation methods on the Indirect Object Identification (IOI) subtask. It shows the median ratio of the optimal ablation (OA) loss gap to the loss gap of other methods (zero, mean, resample, counterfactual mean). The rank correlation of each method with counterfactual ablation (CF) is also provided. The results demonstrate that OA significantly reduces the loss gap compared to other methods.
In-depth insights#
Optimal Ablation#
The concept of “Optimal Ablation” introduces a novel approach to assessing the importance of individual components within machine learning models. Instead of arbitrarily replacing component values with zeros, noise, or means (as in prior ablation methods), OA determines the optimal constant value that minimizes expected loss when that component is disabled. This method provides theoretical advantages by isolating the impact of information deletion from the potentially confounding effects of ‘spoofing’—introducing spurious information. Empirically, OA shows improvements in downstream tasks such as circuit discovery, factual recall localization, and latent prediction, consistently outperforming prior ablation techniques. The core strength lies in OA’s ability to provide a more reliable measure of component importance, leading to a more nuanced and accurate understanding of model behavior and improved interpretability.
Circuit Discovery#
Circuit discovery, a key aspect of neural network interpretability, focuses on identifying minimal subsets of model components crucial for specific tasks. The paper investigates this by proposing optimal ablation (OA), a novel technique to quantify component importance. OA surpasses traditional ablation methods by identifying the component values that minimize the model’s expected loss, effectively isolating the true contribution of a component. This approach is applied to circuit discovery, demonstrating its effectiveness in creating smaller and lower-loss circuits than previous techniques, improving the efficiency and interpretability of circuit identification. The paper further introduces novel search algorithms for sparse circuit discovery, making the process more robust and scalable. The application of OA is demonstrably superior in several downstream interpretability tasks, showcasing its versatility and potential in furthering the understanding of complex neural networks.
Factual Recall#
The section on “Factual Recall” delves into the fascinating intersection of interpretability and large language models (LLMs). It examines how LLMs store and retrieve factual information, a critical aspect of their functionality, and investigates methods for identifying specific model components responsible for accessing this knowledge. The authors employ a novel technique, Optimal Ablation (OA), to isolate components involved in factual recall, surpassing existing methods like Gaussian noise tracing in precision. OA’s efficacy is demonstrated through experiments on the Indirect Object Identification task. OA-tracing excels at pinpoint accuracy in identifying important neural units for factual retrieval, providing valuable insight into the internal mechanisms of LLMs and potentially facilitating interventions to enhance or mitigate these capabilities.
Latent Prediction#
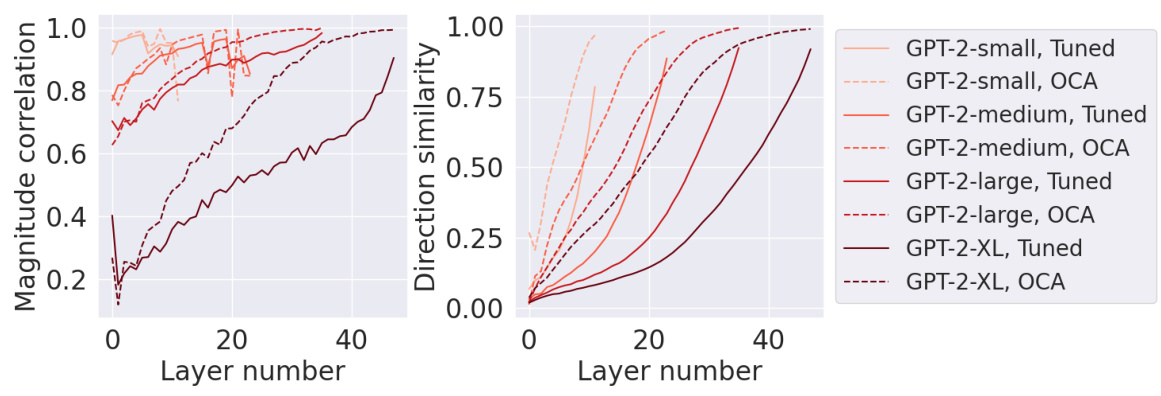
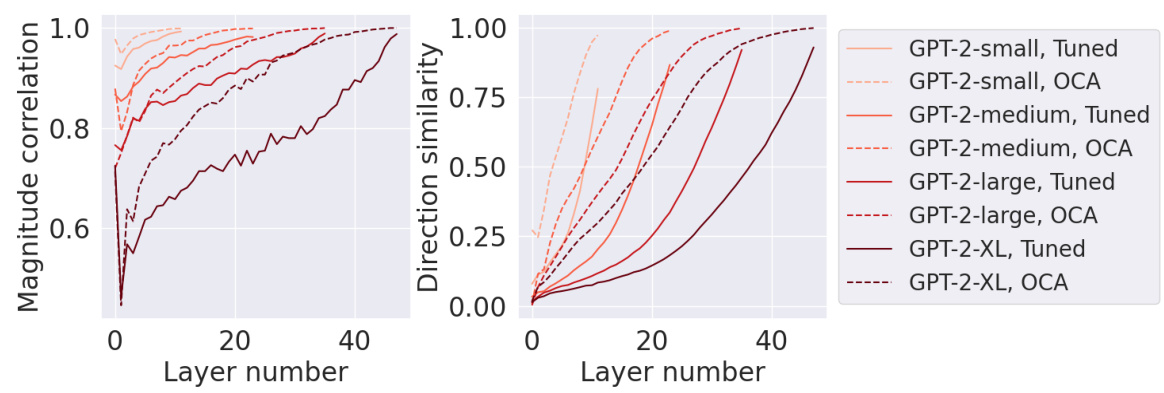
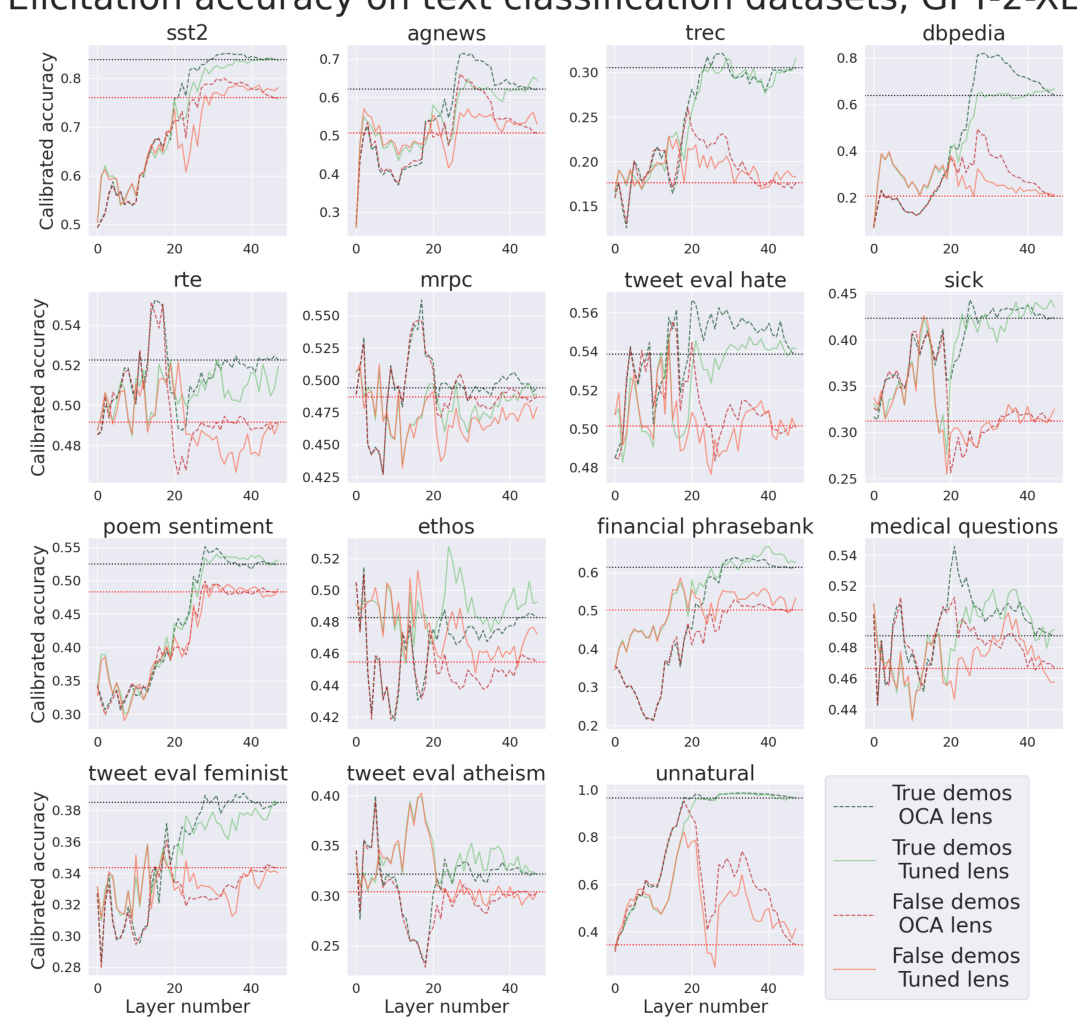
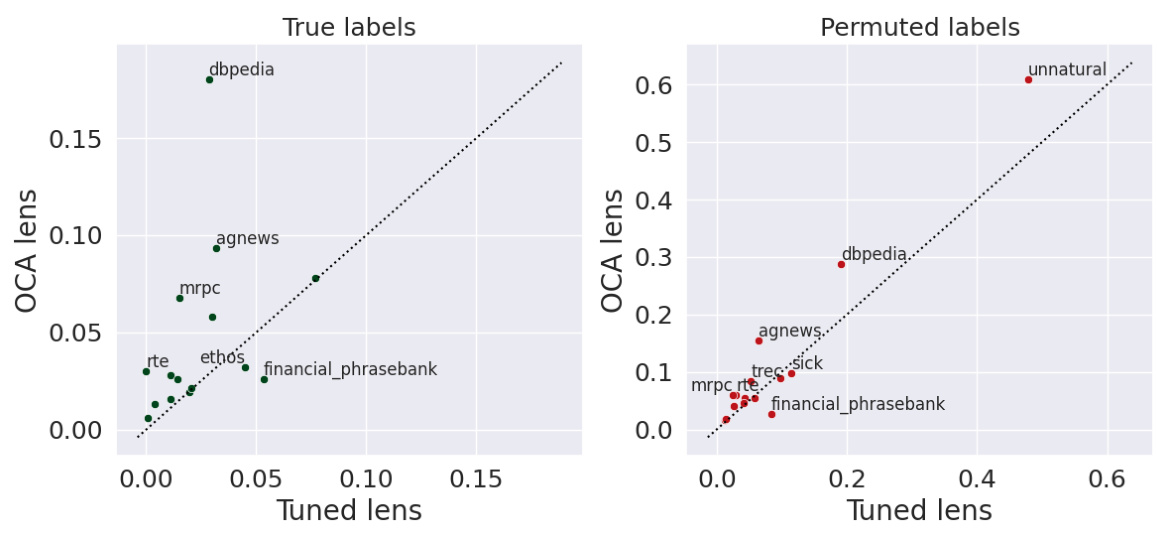
The concept of ‘Latent Prediction’ in the context of this research paper refers to eliciting predictions directly from a model’s internal representations, specifically intermediate activations within its layers, rather than relying solely on its final output. This approach is valuable because it allows for probing the model’s internal mechanisms and understanding how information is processed and transformed at different stages. The paper explores this idea using Optimal Ablation (OA), a novel technique for measuring component importance. By strategically ablating (removing or modifying) parts of the model, they quantify how critical intermediate layers are for predicting the final result. The method presented offers a potential improvement over prior methods such as tuned lens by being more efficient and potentially better at capturing causal relationships within the model. The aim is to better understand the model’s internal reasoning, facilitating enhanced interpretability, causal faithfulness, and improved prediction accuracy, especially in situations like factual recall or situations involving ambiguous or inconsistent contextual information.
Interpretability#
The concept of ‘interpretability’ in machine learning is explored in depth, focusing on quantifying the importance of model components. The paper challenges existing ablation methods by introducing optimal ablation (OA), a technique that identifies the component value minimizing expected loss. This approach offers theoretical and empirical advantages, demonstrating improved performance in various downstream tasks. Circuit discovery benefits from OA’s ability to identify smaller, lower-loss circuits compared to prior methods. Moreover, OA enhances factual recall localization by more accurately pinpointing relevant components and improving latent prediction. The study highlights OA’s superiority in isolating the contribution of components, minimizing the impact of “spoofing” artifacts prevalent in other techniques, and offering a more nuanced and accurate assessment of component importance. Causal faithfulness is also improved when employing OA for latent predictions, resulting in more reliable and trustworthy interpretations.
More visual insights#
More on figures

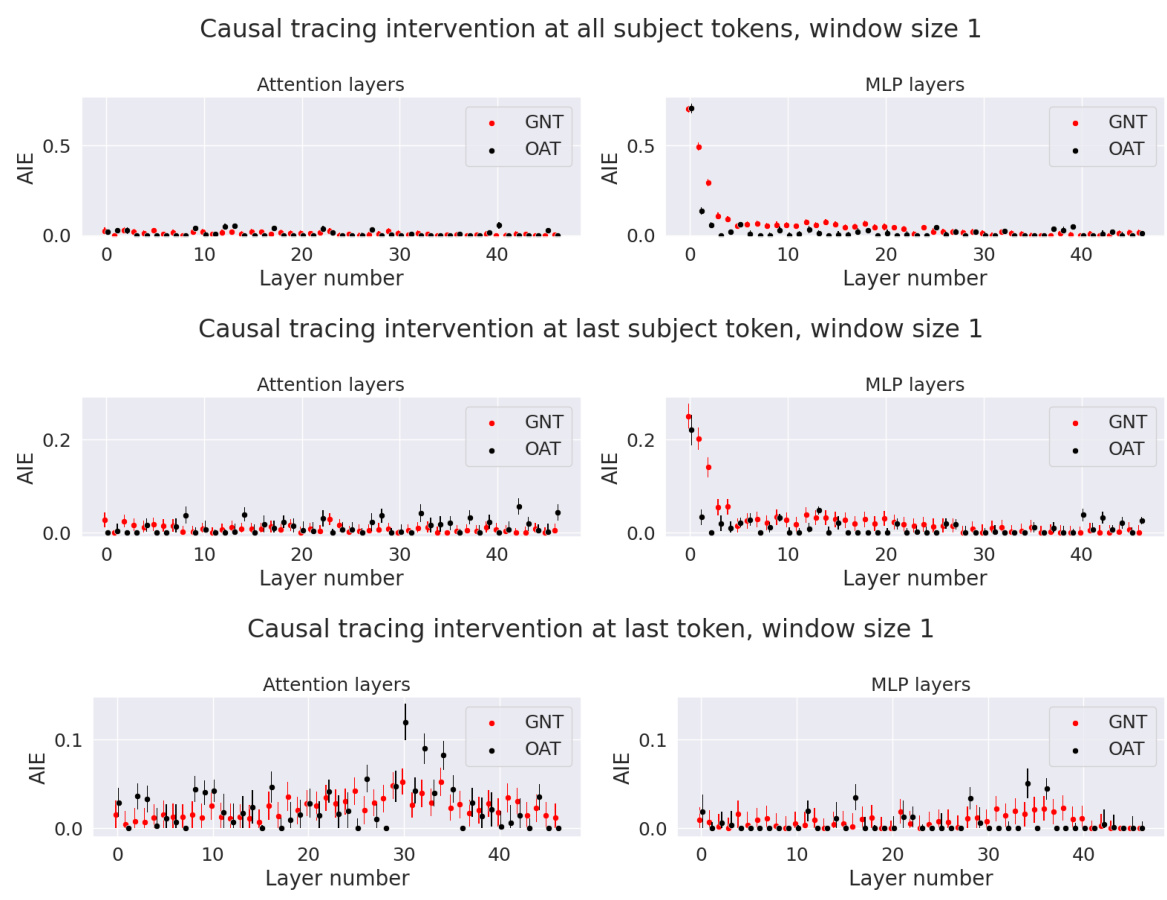
The figure shows the comparison of Average Indirect Effect (AIE) between Gaussian Noise Tracing (GNT) and Optimal Ablation Tracing (OAT) methods for factual recall. The top part shows the results for a window size of 5 layers, while the bottom shows results for a window size of 1 layer. Both attention and MLP layers are evaluated. Error bars representing two standard errors are included for each data point, indicating the variability of the estimates.

The figure shows two plots related to circuit discovery using different ablation methods. The left plot displays the Pareto frontier for the Indirect Object Identification (IOI) subtask, showing the trade-off between ablation loss (y-axis) and the number of edges in the circuit (x-axis). The right plot compares the ablation loss achieved by different methods (zero, mean, resample, counterfactual, optimal ablation) across various circuit sizes, also for the IOI subtask. The manual circuit is included as a benchmark.

The figure demonstrates the performance of different circuit discovery methods on the IOI subtask. The left panel shows the Pareto frontier for counterfactual ablation, illustrating the trade-off between circuit size and ablation loss. The right panel compares the performance of various ablation methods, including optimal ablation, showcasing the achieved ablation loss for different circuit sizes.

The figure illustrates the potential bias in gradient updates for ablation constants a when partial ablation coefficients ak are not equal to 0. It shows that updating a using a linear combination of a and Aj(X) (incorrect update) can lead to a different direction than updating only using the gradient of the loss with respect to a (correct update), ultimately resulting in a bias toward the incorrect value of a*. The correct update directly targets the minimum loss, while the incorrect update is influenced by both the gradient and the initial value of the constant.
The figure shows two plots related to circuit discovery using different ablation methods. The left plot is a Pareto frontier showing the tradeoff between the number of edges in the circuit and the ablation loss for the IOI subtask using counterfactual ablation. The right plot compares the ablation loss of different ablation methods (zero, mean, resample, counterfactual, optimal, and manual) against the number of edges in the circuit for the IOI subtask. The x-axis represents the number of edges in the circuit, and the y-axis represents the ablation loss. The plots show that optimal ablation achieves the best tradeoff between the number of edges and ablation loss.
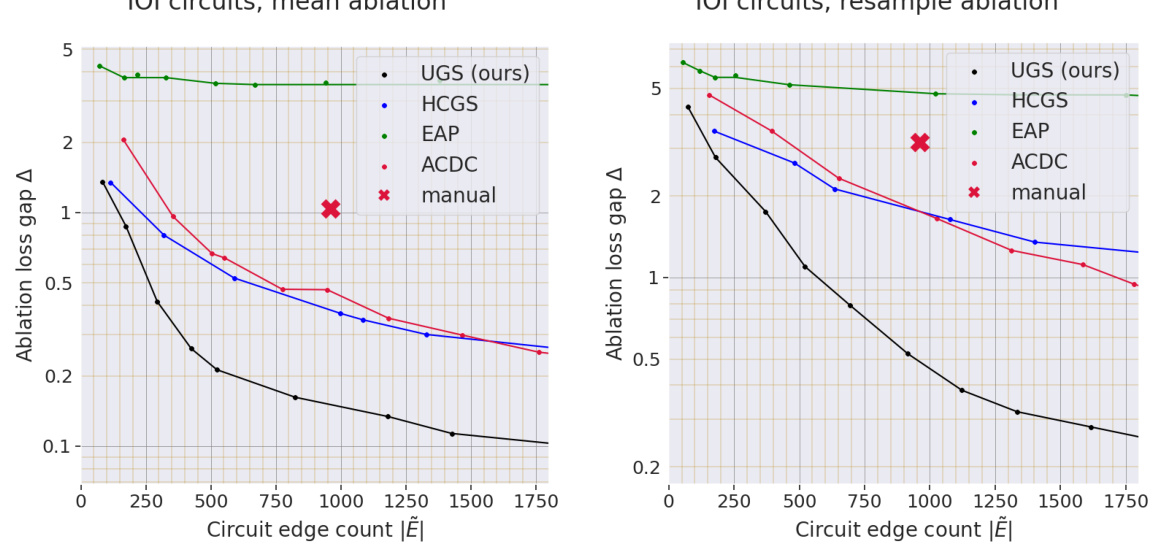
This figure shows the Pareto frontier for circuit discovery on the IOI subtask using mean and resample ablation methods. The x-axis represents the number of edges in the circuit (circuit edge count), and the y-axis represents the ablation loss gap (△). The ablation loss gap measures how much worse the model performs when the selected edges are removed (ablated) compared to the model’s original performance. The plots show the trade-off between the number of edges in the circuit (sparsity) and the ablation loss gap (performance). Lower ablation loss gaps and fewer edges indicate a more efficient, interpretable circuit. The figure compares different circuit discovery algorithms (UGS, HCGS, EAP, ACDC) and a manually selected circuit against the mean and resample ablation methods.
The left panel shows the Pareto frontier for circuit discovery on the Indirect Object Identification (IOI) subtask, comparing the tradeoff between ablation loss gap and circuit size (number of edges) across several methods, including UGS (the authors’ method), HCGS, EAP, ACDC and a manually constructed circuit. The right panel provides a direct comparison of the different ablation methods. It shows the ablation loss gap for each method applied to each circuit size (number of edges) for the same IOI task.
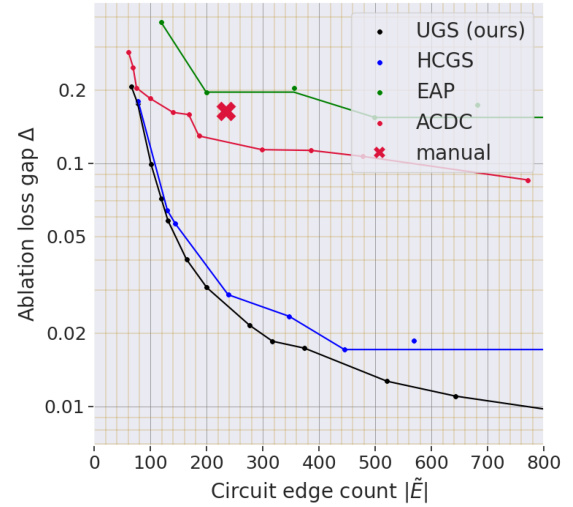
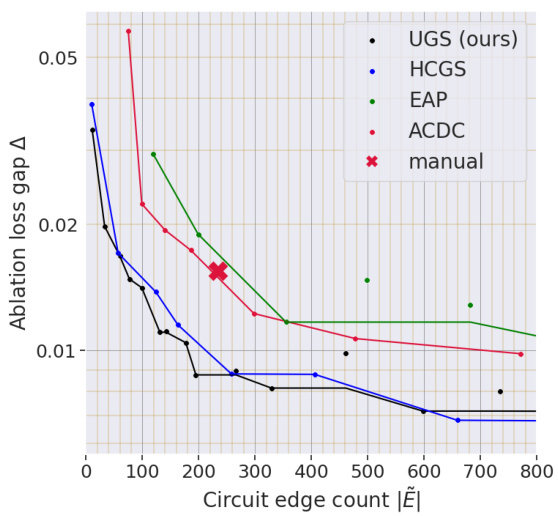
The figure shows two plots related to circuit discovery. The left plot is a Pareto frontier showing the tradeoff between the number of edges in a circuit and its ablation loss, calculated using counterfactual ablation. The right plot compares different ablation methods (Zero, Mean, Resample, Counterfactual, Optimal, and a manually-selected circuit) regarding their ablation loss values for varying numbers of edges in the circuit. The x-axis in both graphs represents the number of edges in the circuit. The y-axis represents the ablation loss gap (Δ), a measure of the difference in performance between the full model and the model with the specified edges removed. The KL-divergence is used as the performance metric.
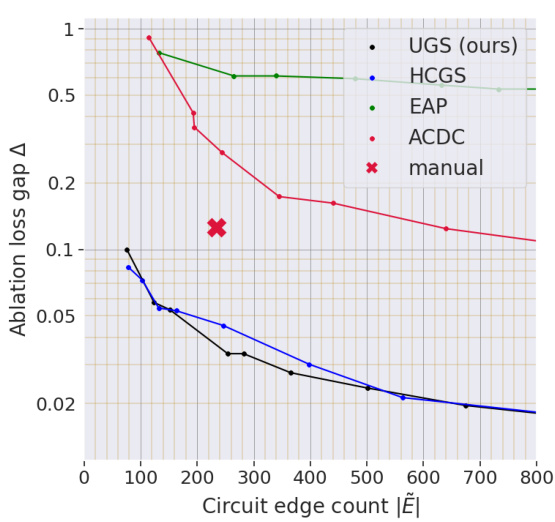
The left panel shows the Pareto frontier for circuit discovery on the Indirect Object Identification (IOI) subtask using counterfactual ablation. The Pareto frontier plots the ablation loss gap (a measure of performance loss after removing edges) against the number of edges in the circuit. It compares the performance of several algorithms (UGS, HCGS, EAP, ACDC) to that of a manually-constructed circuit. The right panel compares the ablation loss gap for different ablation methods (Optimal, Mean, Resample, CF) for circuits discovered on the same IOI task, showing the relative performance of different circuit selection approaches. The manual circuit is included for comparison, marked by an X.
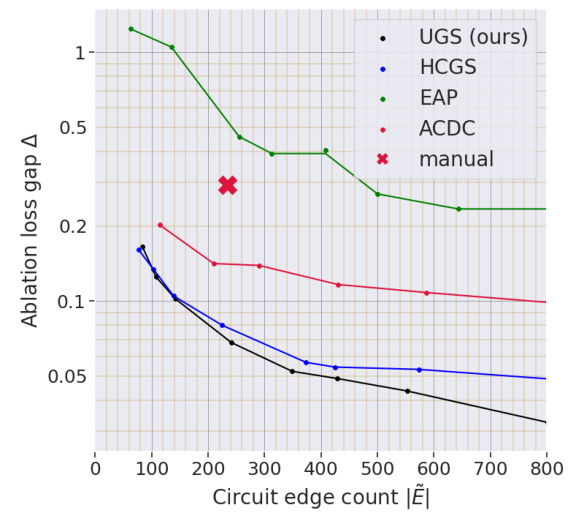
This figure shows two plots related to circuit discovery using different ablation methods on the IOI subtask. The left plot displays the Pareto frontier for circuit discovery using counterfactual ablation, showing the tradeoff between ablation loss gap and circuit size. The right plot compares the performance of various ablation methods (zero, mean, resample, counterfactual, and optimal) across different circuit sizes, highlighting the superior performance of optimal ablation.
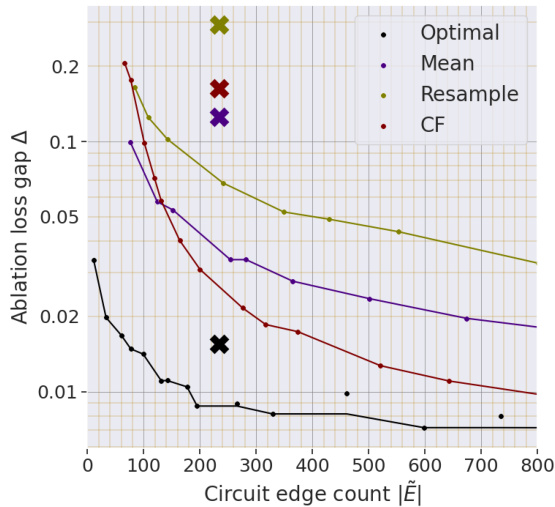
The figure shows two plots related to circuit discovery using different ablation methods on the IOI subtask. The left plot is a Pareto frontier showing the trade-off between ablation loss gap and the number of edges in the circuit for various methods, including the proposed Optimal Ablation. The right plot compares the ablation loss gap achieved by different methods for different sizes of circuits, with the manual circuit also plotted for reference.
The figure presents two plots related to circuit discovery using different ablation methods. The left plot shows the Pareto frontier for the Indirect Object Identification (IOI) subtask with counterfactual ablation, illustrating the tradeoff between the number of edges in a circuit and its ablation loss gap. The right plot compares the performance of different ablation methods (zero, mean, resample, counterfactual, and optimal) in circuit discovery for IOI, highlighting the performance of a manually designed circuit as a benchmark.

This figure compares the Average Indirect Effect (AIE) of Gaussian Noise Tracing (GNT) and Optimal Ablation Tracing (OAT) for identifying components responsible for factual recall in a language model. The top row shows the AIE for a sliding window of 5 layers, while the bottom row shows the AIE for single layers. Error bars represent the uncertainty in the AIE estimates.

This figure compares the Average Indirect Effect (AIE) of removing information about the subject using Gaussian noise (GNT) and Optimal Ablation (OAT). The AIE is a measure of how much a component contributes to the model’s ability to recall a fact. The top half shows AIE values for replacing sliding windows of 5 layers with the median layer, while the bottom half shows AIE values for replacing single layers. Error bars represent the sample standard errors. The results show that OAT more precisely identifies important components compared to GNT.

This figure compares the Average Indirect Effect (AIE) of Gaussian noise tracing (GNT) and Optimal Ablation tracing (OAT) for identifying components responsible for factual recall in a transformer model. The x-axis represents the layer number (or median layer in a sliding window of 5 layers). The y-axis shows the AIE. The top row shows results for a sliding window of 5 layers, while the bottom row shows results for a window of 1 layer. Each panel shows results for attention layers and MLP layers separately. The error bars indicate the 95% confidence intervals for the AIE estimates.

This figure compares the average indirect effect (AIE) of Gaussian noise tracing (GNT) and optimal ablation tracing (OAT) for different layers in a transformer model. The top row shows results for a sliding window of 5 layers, while the bottom row shows results for a single layer. Error bars represent the standard error of the estimate.

The figure compares the Average Indirect Effect (AIE) of Gaussian Noise Tracing (GNT) and Optimal Ablation Tracing (OAT) for different layers of a transformer model. It shows that OAT provides more precise localization of relevant components compared to GNT. The x-axis represents the layer number, and the y-axis represents the AIE, a measure of a component’s contribution to factual recall.

The figure compares the average indirect effect (AIE) of Gaussian noise tracing (GNT) and optimal ablation tracing (OAT) for different layers of a transformer model. It shows AIE values for attention and MLP layers when a sliding window of 5 layers is replaced with constant values. The x-axis represents the median layer of the window and the y-axis shows the AIE values. Error bars indicate the standard error of the mean.

The left panel shows the Pareto frontier for circuit discovery on the Indirect Object Identification (IOI) subtask using counterfactual ablation. It compares the tradeoff between the number of edges in a circuit and the resulting ablation loss. The right panel compares different ablation methods (mean, resample, optimal, and counterfactual) for circuit discovery on the same IOI subtask, including a manual circuit for reference, showing which approach yields lower ablation loss for a given number of edges.
The left panel shows the Pareto frontier for circuit discovery on the IOI subtask, comparing the ablation loss against the number of edges in the circuit. The right panel shows a comparison of different ablation methods (mean, resample, optimal, and counterfactual) for circuit discovery on the same IOI subtask. It highlights the relative performance of each method in finding smaller, lower-loss circuits compared to the manually curated circuit (marked with X).

The figure demonstrates the results of circuit discovery experiments. The left panel shows the Pareto frontier for the Indirect Object Identification (IOI) subtask using counterfactual ablation. It compares various methods for identifying a sparse subnetwork that achieves low loss on the IOI subtask. The right panel compares the different ablation methods across multiple circuit discovery algorithms and highlights the performance of optimal ablation.
The figure shows two plots related to circuit discovery on the Indirect Object Identification (IOI) subtask. The left plot displays the Pareto frontier for circuit discovery using counterfactual ablation, illustrating the trade-off between the number of edges in the circuit and the ablation loss. The right plot compares different ablation methods (zero, mean, resample, counterfactual, and optimal ablation) for circuit discovery, showing the ablation loss achieved by various circuits across these methods. The manual circuit is also included for reference. KL-divergence is used as the performance metric.

The left panel shows the Pareto frontier for circuit discovery on the Indirect Object Identification (IOI) subtask, comparing different methods (UGS, HCGS, EAP, ACDC, manual) with counterfactual ablation. The x-axis represents the number of edges in the circuit, and the y-axis represents the ablation loss gap (KL-divergence). The right panel compares the ablation loss gap for those same methods on the IOI subtask, showing the trade-off between circuit size and performance for each approach. The manual circuit’s performance provides a benchmark.
The left panel shows the Pareto frontier for circuit discovery on the Indirect Object Identification subtask using counterfactual ablation. It compares the performance (ablation loss gap) of circuits of varying sizes discovered by different methods (UGS, HCGS, EAP, ACDC, manual) against the number of edges in the circuit. The right panel shows a comparison of the ablation loss gaps for the same subtask using different ablation methods (optimal, mean, resample, CF), demonstrating the relative performance of optimal ablation.
The figure shows two plots related to circuit discovery using different ablation methods on the Indirect Object Identification (IOI) subtask. The left plot is a Pareto frontier showing the trade-off between circuit size (number of edges) and ablation loss using counterfactual ablation. The right plot compares ablation loss achieved by different ablation methods (zero, mean, resample, counterfactual, and optimal) for circuits of varying sizes, including a manually-constructed circuit, using KL-divergence as the performance metric.
More on tables

This table presents a comparison of the ablation loss gap (Δ) for different ablation methods on the Indirect Object Identification (IOI) subtask. The ablation loss gap quantifies the importance of a model component by measuring the difference in performance between the full model and a modified version with the component ablated. The table shows the median ratio of the optimal ablation loss gap to the loss gap for other ablation methods (zero, mean, resample, counterfactual mean, and counterfactual) providing a comparison of the relative performance of optimal ablation in minimizing this gap.

This table presents a comparison of the ablation loss gap (∆) for different ablation methods on the Indirect Object Identification (IOI) subtask. It shows the median ratio of the optimal ablation loss gap (∆opt) to the loss gap calculated using zero, mean, resample, counterfactual mean, and counterfactual ablation methods. The rank correlation with counterfactual ablation (CF) is also provided for each method to show the relative performance.

This table presents a comparison of the loss achieved by circuits optimized using the UGS algorithm against the loss achieved by random circuits. The comparison is done for four different ablation methods: Mean, Resample, Optimal, and Counterfactual. Two subtasks are considered: IOI (Indirect Object Identification) and Greater-Than. For each ablation method and subtask, the table shows the mean loss for random circuits, the mean loss for UGS-optimized circuits, the standard deviation of the loss (Std), and the Z-score, which measures the statistical significance of the difference in performance between random and optimized circuits.
Full paper#


