↗ OpenReview ↗ NeurIPS Proc. ↗ Chat
TL;DR#
Estimating optimal transportation plans is computationally expensive, especially for high-dimensional data, which is a major challenge for NOT solvers. Existing NOT methods often suffer from instability in finding a precise approximation of the conjugate operator (c-transform) requiring extensive fine-tuning. This process is computationally intensive and may not converge to an optimal solution.
The paper proposes ENOT, a novel method employing expectile regularization to address these issues. Expectile regularization provides a stable upper bound estimation for the distribution of possible conjugate potentials, eliminating the need for extra fine-tuning. ENOT outperforms state-of-the-art methods on standard benchmarks, offering substantial improvements in terms of quality and training time. The method’s efficiency and effectiveness are further demonstrated through its application to image generation tasks.
Key Takeaways#
Why does it matter?#
This paper is crucial for researchers in optimal transport and machine learning due to its significant improvement in training speed and accuracy. ENOT’s novel expectile regularization offers a solution to the long-standing challenge of efficiently estimating optimal transport plans. It opens avenues for further research in high-dimensional problems and various applications, including image generation and beyond.
Visual Insights#

This figure compares three different methods for estimating optimal transport maps: Sinkhorn divergence, Monge gap, and the proposed ENOT method. Each method’s results are visualized by showing the mappings between source and target probability measures in a 2D space. The Euclidean distance is used as the cost function. The figure aims to illustrate the performance of ENOT relative to existing methods in terms of the accuracy and visual quality of the resulting transport map.

This table compares the performance of ENOT against several state-of-the-art methods on the CelebA64 dataset from the Wasserstein-2 benchmark. The comparison uses the LUV metric to quantify the quality of the optimal transport plan approximation. Three different optimizers (None, L-BFGS, Adam) and three different loss types (‘Cycle’, ‘Objective’, ‘Regression’) are used for the competing methods. The table shows the mean and standard deviation of the LUV score across three different seeds for each method. The best results are highlighted.
In-depth insights#
ENOT: A New Approach#
The proposed approach, ENOT, presents a novel regularization technique for training Neural Optimal Transport (NOT) models. Its core innovation lies in using expectile regularization to address the challenges of approximating the c-transform, a computationally intensive step in existing NOT methods. This regularization stabilizes the training process by enforcing binding conditions on the dual potentials, thus eliminating the need for extensive fine-tuning. ENOT demonstrates significant improvements in both accuracy and speed over current state-of-the-art NOT approaches across various benchmarks, showcasing its effectiveness and robustness across different cost functions and tasks. The theoretical justification for the expectile regularization adds further credence to the method’s soundness. The work highlights ENOT as a promising technique for various applications demanding efficient and accurate optimal transport estimations.
Expectile Regularization#
The core idea of “Expectile Regularization” within the context of Neural Optimal Transport (NOT) training is to stabilize and accelerate the learning process by directly regularizing the dual Kantorovich potentials. Instead of relying on computationally expensive and unstable methods to approximate the c-transform (conjugate transformation), expectile regression is used. This method, by minimizing asymmetrically weighted squared errors, implicitly enforces binding conditions on the potentials, making the learning more robust. This regularization is theoretically justified and empirically shown to significantly improve the accuracy and efficiency of NOT, particularly by reducing the instability associated with finding near-exact solutions to the conjugate operator. The expectile parameter provides control over the emphasis placed on different regions of the potential distribution, which allows for flexibility and adaptability in addressing the nuances of specific OT problems. The effectiveness of this approach is highlighted by consistent state-of-the-art results across diverse benchmark tasks and cost functions.
ENOT’s Performance#
The paper demonstrates ENOT’s superior performance across diverse benchmarks. ENOT consistently outperforms state-of-the-art methods in Wasserstein-2 benchmark tasks, achieving significant improvements in both accuracy (LUV scores) and runtime. This is particularly noteworthy for high-dimensional tasks, where ENOT shows a substantial speedup compared to baselines. The success extends beyond established benchmarks; in image-to-image translation, ENOT delivers competitive FID and MSE scores, demonstrating generalizability to generative tasks. The expectile regularization is a key element contributing to ENOT’s robustness and efficiency, avoiding instability issues common in other neural optimal transport methods. Overall, the results strongly support the effectiveness of ENOT as a fast and accurate method for solving neural optimal transport problems.
Limitations and Future#
The research makes significant strides in neural optimal transport (NOT) with its novel expectile regularization method, ENOT. However, acknowledging limitations is crucial for responsible research. ENOT’s reliance on two hyperparameters (expectile coefficient and loss weight) necessitates re-evaluation for new datasets, potentially impacting its ease of application. While demonstrating superior speed and accuracy, the theoretical grounding could be further strengthened, providing more rigorous proofs and extending the analysis to a wider range of cost functions beyond the squared Euclidean distance. Future work should explore these theoretical underpinnings, evaluate ENOT’s performance on more diverse and complex datasets, and investigate applications in high-dimensional tasks like image generation and dynamical optimal transport settings. Addressing potential biases in datasets used for training and evaluation is important to ensure fairness and generalizability. Extending the applicability of the method to different cost functions and exploring alternative regularization techniques would further enhance its versatility and robustness.
Broader Impacts#
The research paper’s omission of a ‘Broader Impacts’ section is notable. While the work focuses on advancing Optimal Transport methods, lacking discussion of potential societal effects is a shortcoming. The algorithm’s applications in image generation and other machine learning tasks could lead to both positive (e.g., improved image synthesis for art or medical imaging) and negative impacts (e.g., creation of deepfakes or biased data representations). Future work should explicitly address these potential consequences, considering ethical implications and developing mitigation strategies. For example, exploring techniques to ensure fairness and prevent misuse is crucial. A broader impact analysis would significantly strengthen the paper’s contribution by providing a more holistic view and promoting responsible innovation.
More visual insights#
More on figures

This figure compares the performance of three different optimal transport methods (Sinkhorn, Monge, and ENOT) on a 2-sphere dataset using a geodesic cost function. The plots visualize the recovered optimal transport maps (Tθ), showing the mappings between source and target measures. The blue dots represent the source measure, red crosses the target measure, and orange crosses show the result of the transport map (push-forward). The figure demonstrates how each method achieves different results in terms of the mappings found.

This figure shows the results of unpaired image-to-image translation using the ENOT method. Three different translation tasks are presented: handbags to shoes, FFHQ faces to comic faces, and CelebA female faces to anime faces. For each task, the top row displays the source images, and the bottom row shows the corresponding images generated by ENOT. The figure visually demonstrates the model’s ability to translate images between different domains.

This figure shows contour plots illustrating the impact of the hyperparameters expectile (τ) and regularization weight (λ) on the unexplained variance percentage (LUV) metric across different dimensions (D=256, 128, 64). The plots reveal the optimal regions for τ and λ that minimize LUV. Grey areas indicate where the OT solver failed to converge.
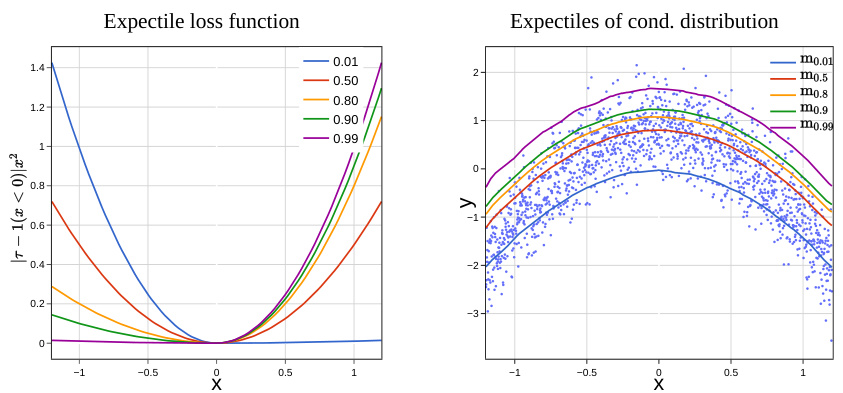
The figure demonstrates expectile regression. The left panel shows the asymmetric squared loss function Lτ, highlighting how different τ values (0.01, 0.5, 0.8, 0.9, 0.99) affect the weighting of positive and negative differences. The right panel illustrates the resulting expectile models fτ(x) for the same τ values. It shows how the model shifts from representing the conditional mean (τ = 0.5) towards approximating the conditional maximum (as τ approaches 1).

This figure shows contour plots illustrating the relationship between the unexplained variance percentage (LUV) metric, the expectile hyperparameter τ, and the regularization weight λ across different dimensions (D = 64, 128, 256). The plots visualize how the optimal settings of τ and λ change depending on the dimensionality of the problem. Areas with NaN (Not a Number) values indicate where the optimization diverged, highlighting the impact of the hyperparameters on the stability and accuracy of the model.

This figure shows the results of applying the ENOT method to synthetic datasets from Makkuva et al. (2020) using a squared Euclidean cost function. It displays the recovered optimal transport plans (T(x) and its inverse T⁻¹(y)), which map probability measures α and β, along with contour plots of the learned Kantorovich potentials (f and g). The evaluation metric used is the Sinkhorn distance (W₂), comparing the estimated distance from the learned potentials with the true Wasserstein distance between α and β. The closeness of these distances demonstrates the accuracy of the learned potentials and transport plans.

This figure visualizes the optimal transport plan learned by the ENOT algorithm for a squared Euclidean cost function on synthetic datasets from the Rout et al. (2021) paper. It shows the source and target measures as point clouds and the learned transport map as lines connecting points from the source to the target. The color of the lines might represent the magnitude or other properties of the transport. The figure demonstrates the ability of ENOT to learn accurate and continuous transport maps even on complex datasets.

This figure shows the results of applying the ENOT model to three different image-to-image translation tasks. The top row of each section displays the source images, while the bottom row presents the images generated by the ENOT model after the transport mapping. The tasks demonstrated are: translating images of handbags into images of shoes, translating images from the Flickr-Faces-HQ dataset into images of comic book faces, and translating images of female celebrities from the CelebA dataset into images of anime faces.

This figure shows the results of image-to-image translation using the proposed ENOT method. It presents three different translation tasks: handbags to shoes, high-resolution faces (FFHQ) to comic-style faces, and female celebrity faces (CelebA) to anime-style faces. For each task, the top row displays the source images, and the bottom row shows the corresponding translated images generated by ENOT. The figure visually demonstrates the model’s ability to translate images across different domains while preserving important structural information.
More on tables

This table compares the performance of the proposed ENOT method against several baseline methods on high-dimensional tasks from the Wasserstein-2 benchmark. The comparison is based on the LUV (Unexplained Variance Percentage) metric, which measures the deviation of the estimated optimal transport plan from the ground truth. Different optimizers for computing the c-conjugate transform are also considered. The results show the mean and standard deviation of the LUV metric across five different seeds for each method and varying dimensions (D). The best performing method for each dimension is highlighted.

This table compares the performance of the proposed ENOT method against several baseline methods on high-dimensional tasks from the Wasserstein-2 benchmark. The comparison is based on the LUV (Unexplained Variance Percentage) metric, which measures the deviation from the optimal transport plan. Different optimization strategies (Cycle, Objective, Regression) and conjugate optimizers are used for the baselines, while ENOT uses no conjugate optimization. The table shows the LUV scores for different dimensions (D) of the measure space, highlighting ENOT’s superior performance and efficiency.

This table compares the performance of ENOT against several other methods for image-to-image translation. The comparison uses two metrics: FID (Frechet Inception Distance) and MSE (Mean Squared Error) across four different image translation tasks. Lower values are better for both metrics. Note that some baselines did not report results for all tasks.

This table compares the performance of ENOT against other methods for image-to-image translation tasks. The metrics used for comparison are FID (Frechet Inception Distance) and MSE (Mean Squared Error). The results show ENOT’s performance relative to CycleGAN, StarGAN, Extremal OT, and Kernel OT across various image datasets and resolutions.

This table compares the performance of ENOT against other state-of-the-art methods on the CelebA64 dataset from the Wasserstein-2 benchmark. The comparison is based on the LUV metric (Unexplained Variance Percentage), which measures the deviation from the optimal transport plan. Different optimization strategies and methods for approximating the c-conjugate transform are evaluated. The table shows mean and standard deviation of LUV across multiple runs for each method.
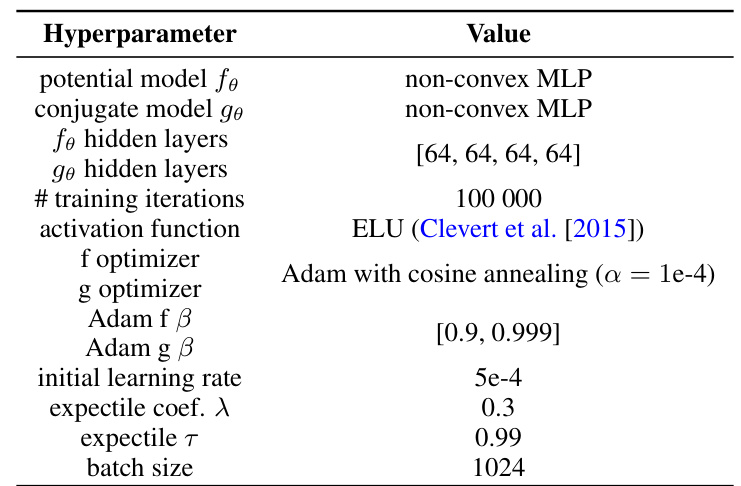
This table shows the hyperparameter settings used for the synthetic 2D datasets experiments from the Rout et al. (2021) paper. It details the specific configurations of the potential model, conjugate model, hidden layers, training iterations, activation function, optimizers, Adam beta parameters, initial learning rate, expectile coefficient, expectile tau, and batch size.
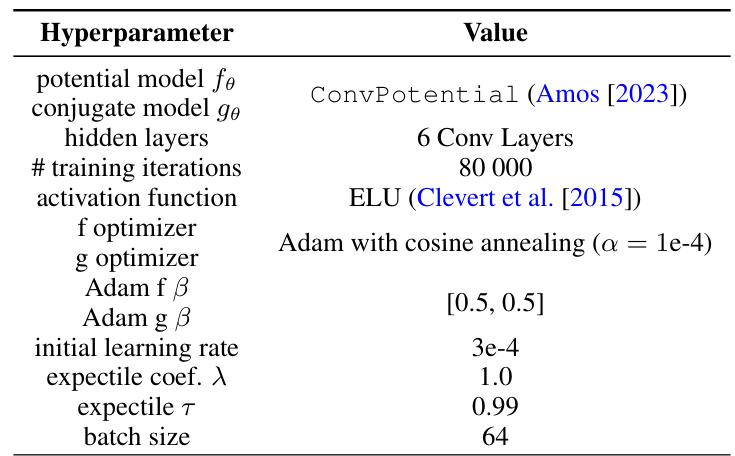
This table lists the hyperparameters used for the CelebA64 Wasserstein-2 benchmark task. It includes specifications for the potential and conjugate models, the number of hidden layers, training iterations, activation function, optimizers (with their beta parameters), initial learning rate, expectile coefficient (λ), expectile τ, and batch size.

This table presents a comparison of the Expectile-Regularized Neural Optimal Transport (ENOT) method with other state-of-the-art approaches on the CelebA64 tasks from the Wasserstein-2 benchmark. The comparison is based on the LUV (Unexplained Variance Percentage) metric, which measures the deviation from the optimal transport plan. The table shows the LUV scores for different methods, broken down by the type of amortisation loss used and the optimizer employed for fine-tuning the c-conjugate transform. The best-performing method is highlighted.
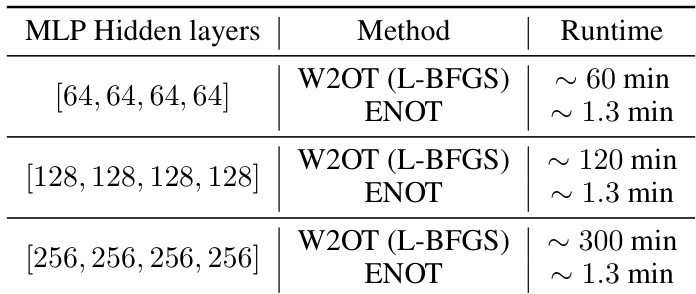
This table compares the runtime of the proposed ENOT method against the W2OT method from Amos (2023) for different numbers of hidden layers in the multi-layer perceptron (MLP) architecture. It demonstrates the significant speed improvement achieved by ENOT compared to W2OT, especially as the number of layers increases. The speed-up highlights one of the key advantages of ENOT: efficiency in training.

This table compares the computation times of the proposed ENOT method against the baseline W2OT-Objective L-BFGS method for high-dimensional tasks from the Wasserstein-2 benchmark. It demonstrates the significant speedup achieved by ENOT across various dimensions (D). The same network architecture was used for a fair comparison.
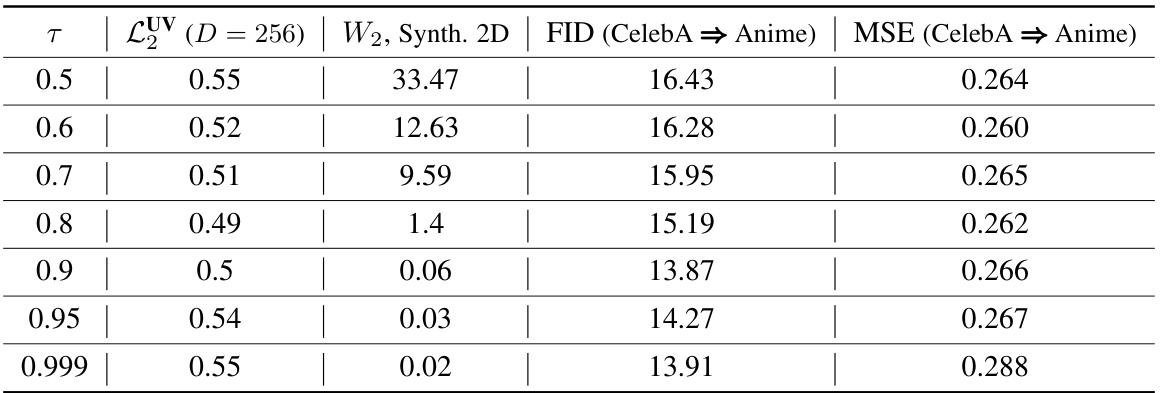
This table presents the performance of the ENOT model on various tasks with different values of the expectile hyperparameter τ. It shows how the model’s performance (measured by LUV, Wasserstein distance, FID, and MSE) changes as τ approaches 1, illustrating the effect of this hyperparameter on model stability and accuracy. The results are presented for four different evaluation metrics across various datasets, highlighting the impact of expectile regularization and its influence on the model’s behavior.
Full paper#


