↗ OpenReview ↗ NeurIPS Proc. ↗ Chat
TL;DR#
Autonomous driving requires robust 3D scene understanding, but existing methods often rely on expensive LiDAR and human-annotated data. Dynamic objects also pose a significant challenge to multi-view consistency in 3D reconstruction. This paper tackles these issues by focusing on multi-traverse driving scenarios.
The paper introduces 3D Gaussian Mapping (3DGM), a self-supervised approach that uses only camera images from multiple traversals of the same route to construct a 3D map. 3DGM separates static parts of the environment from dynamic objects using a robust representation learning technique that treats moving objects as outliers. The results demonstrate superior performance compared to existing supervised and unsupervised methods in unsupervised 2D segmentation, 3D reconstruction, and neural rendering. The Mapverse benchmark, created using the Ithaca365 and nuPlan datasets, allows for comprehensive evaluation of the proposed method and provides a valuable resource for future research in autonomous driving and robotics. The 3DGM model is LiDAR-free and self-supervised, significantly reducing reliance on expensive hardware and human effort.
Key Takeaways#
Why does it matter?#
This paper is important because it presents a novel self-supervised approach to 3D mapping that does not rely on LiDAR, reducing reliance on expensive sensors and human annotation. It also introduces a new benchmark dataset, Mapverse, for evaluating such methods, thereby advancing research in autonomous driving and robotics. The work opens avenues for further research in unsupervised scene understanding and robust representation learning.
Visual Insights#

This figure illustrates the overall pipeline of the 3D Gaussian Mapping (3DGM) framework. The input is multi-traverse RGB videos from the same location, meaning the same route is driven multiple times. The 3DGM processes these videos to produce two outputs: a 3D environmental map represented as Gaussian splatting (EnvGS), and a 2D segmentation mask highlighting ephemeral (temporary) objects (EmerSeg). Importantly, the method doesn’t use LiDAR and is self-supervised, meaning it learns without human-provided labels.

This table compares the Intersection over Union (IoU) scores of the proposed unsupervised method, EmerSeg, against five state-of-the-art supervised semantic segmentation methods (PSPNet, SegViT, InternImage, Mask2Former, and SegFormer) on the Mapverse-Ithaca365 dataset. The IoU metric measures the overlap between the predicted segmentation masks and the ground truth masks. The * indicates models that were not trained on the dataset. The table highlights that EmerSeg, despite being unsupervised, achieves comparable performance to the supervised methods.
In-depth insights#
Multiverse Mapping#
Multiverse mapping, as a concept, is intriguing. It suggests a paradigm shift from traditional single-traversal mapping to a system that leverages information from multiple traversals of the same environment to improve mapping accuracy and robustness. The core idea is to distinguish between persistent environmental features and transient elements (like pedestrians or vehicles) by identifying consensus across multiple observations. This allows for a more accurate 3D reconstruction of the static environment, while simultaneously segmenting transient objects, leading to a more complete and accurate understanding of the scene. The key challenges would involve efficiently handling dynamic objects, robustly registering data across traversals despite varying weather or lighting conditions, and developing efficient algorithms for processing potentially large volumes of data from multiple traversals. The success of such a system would likely rely on effective methods for self-supervision and the development of robust feature representations capable of differentiating permanent and transient structures, ultimately improving the reliability and accuracy of robotic mapping in dynamic environments. Therefore, multiverse mapping holds great promise for advancements in autonomous navigation and robotics applications.
3D Gaussian Mapping#
The concept of “3D Gaussian Mapping” presents a novel approach to robotic scene understanding. It leverages the power of multi-traverse data, meaning repeated observations of the same environment from varying viewpoints, to disentangle persistent scene elements from transient objects. The core idea is to represent the 3D world using a collection of 3D Gaussian distributions, where each Gaussian encodes the properties (position, color, etc.) of a specific spatial region. By analyzing consistency across multiple traversals, the system effectively learns to distinguish the enduring aspects of the environment from the fleeting ones. This self-supervised approach, free from LiDAR and human annotation, is particularly significant for autonomous driving, where dynamic objects present a major challenge to accurate 3D mapping. The use of robust feature distillation and optimization further enhances its robustness and accuracy. This method offers a promising direction for creating robust and efficient scene representations.
Robust Feature Mining#
Robust feature mining, in the context of scene decomposition from multitraverse driving data, focuses on effectively extracting features that are invariant to transient elements while maintaining sensitivity to the permanent environment. This is achieved by leveraging the spatial information present in rendering loss maps. The approach uses feature distillation, often employing pre-trained models, to obtain robust, semantic-rich representations that are less susceptible to noise from dynamic objects like pedestrians or vehicles. Then, feature residual mining identifies outliers (transient elements) and inliers (permanent structures). Outliers are identified through analysis of feature residuals: pixels exhibiting high loss are likely associated with transient objects. This method provides a self-supervised approach for object segmentation, avoiding the need for explicit human annotation. The spatial information in the residuals is crucial to accurately group outliers and create accurate 2D masks for transient objects. This approach results in a robust 3D map representation, with the permanent structures accurately modeled while transient objects are effectively removed.
Mapverse Benchmark#
The Mapverse benchmark, a crucial contribution of this research, is designed to rigorously evaluate the performance of 3D Gaussian Mapping (3DGM) in unsupervised settings. Its strength lies in its multitraverse nature, utilizing repeated traversals of the same routes to offer rich self-supervision, a departure from traditional single-traversal datasets. Sourced from the Ithaca365 and nuPlan datasets, it provides a diverse range of real-world driving scenarios, encompassing various geographic locations and environmental conditions, such as varied weather and lighting. Mapverse assesses 3DGM’s capabilities across three key tasks: unsupervised 2D segmentation, 3D reconstruction, and neural rendering, providing a holistic evaluation of the method’s effectiveness. The release of the Mapverse dataset and code contributes to the broader community’s efforts in developing autonomous driving and robotics technologies. By offering a standardized and challenging benchmark, the research significantly advances the field of self-supervised scene understanding.
Future Directions#
The paper’s core contribution is a novel self-supervised, camera-only method for 3D scene decomposition using multi-traversal data. Future work should focus on enhancing robustness to various environmental challenges, such as lighting changes, adverse weather, and seasonal variations. Addressing limitations in accurately segmenting shadows and handling large occluders or long-range objects is crucial. Improving the handling of reflective surfaces would also improve results. Integrating advanced techniques like mesh reconstruction and incorporating 4D representations to account for changes over time could significantly improve the system’s 3D reconstruction capabilities. Scaling the method to handle very large-scale scenes via Level-of-Detail (LOD) techniques is another important area for future development. Finally, exploring the potential of the method in other applications such as change detection, object discovery, and 3D auto-labeling with LiDAR data, shows additional avenues for future research.
More visual insights#
More on figures

This figure illustrates the overall workflow of the 3D Gaussian Mapping (3DGM) method. It starts with multisession data collection from driving trajectories using a monocular camera to capture RGB images. COLMAP is used to estimate camera poses and initialize 3D Gaussian points representing the environment. These Gaussians are then used in a splatting-based rasterizer to generate rendered RGB images and robust features. A loss function compares these to ground truth data, creating a feature loss map. From the loss map, feature residual mining extracts 2D ephemerality masks which identify transient objects. Finally, these masks are used to refine the 3D environmental Gaussians, leading to an improved environment map and object segmentation.

This figure shows the Intersection over Union (IoU) scores achieved by the proposed EmerSeg method across 20 different locations within Ithaca, NY. The x-axis represents the location index, and the y-axis represents the IoU score. The graph visually depicts the variability in performance across different locations, highlighting areas where the method performs exceptionally well (high IoU) and areas where performance is less strong (low IoU). This provides a comprehensive assessment of the EmerSeg algorithm’s robustness and consistency across various geographic settings within a city.

This figure shows sample images from the Mapverse-nuPlan dataset, specifically locations 11 through 20. Each row represents a different location, and each column shows the same location captured at different times (different traversals). The images show diverse urban scenes in Las Vegas, illustrating the variation in appearance and traffic conditions over multiple traversals.

This figure presents a qualitative and quantitative comparison of the 3D geometry reconstruction results obtained using the proposed method (EnvGS) and a baseline method (DepthAnything). The left panel (a) shows depth visualizations for 20 locations in the Mapverse-Ithaca365 dataset, demonstrating EnvGS’s ability to generate accurate and smooth depth maps. The right panel (b) presents a quantitative comparison in the form of a bar chart, showing the Chamfer Distance (CD) between the reconstructed depth and the ground truth LIDAR depth for each location. The chart reveals that EnvGS significantly outperforms DepthAnything in terms of accuracy across all locations, with lower CD values indicating higher precision.

This figure shows a qualitative comparison of environment rendering results between different methods. The top row displays original RGB images, followed by results from 3DGS, 3DGS+SegFormer, and EnvGS (the proposed method). The results demonstrate that EnvGS outperforms other methods in handling transient objects and removing object shadows, maintaining robust performance even without a pretrained model.

This figure visualizes sample data from the Mapverse-Ithaca365 dataset, showcasing various environments and conditions across multiple traversals of ten different locations in Ithaca, NY. Each row shows images from the same location at different times, highlighting the consistent background elements and the changes in transient objects like vehicles and pedestrians.

This figure shows example images from the Mapverse-Ithaca365 dataset. Each row displays images from the same location taken during different traversals, showcasing how the scene changes over time. The dataset includes diverse environments, ranging from residential areas to highways, with varying weather and traffic conditions.

This figure shows sample images from the Mapverse-nuPlan dataset, specifically locations 1 through 10. Each row represents a single location, with 5 different traversals shown across the columns. The images depict diverse Las Vegas environments, highlighting the variability in cityscapes across multiple driving conditions. This showcases the dataset’s complexity and variety.

This figure shows example images from the Mapverse-nuPlan dataset, focusing on locations 1-10. Each row displays images of the same location taken during multiple traversals of the area, demonstrating how the visual appearance of a location can vary across different traversals due to changing traffic, weather, and lighting. The variety of scenes reflects different areas within Las Vegas.

This figure presents qualitative results of the 2D ephemeral object segmentation. It shows the original RGB images and the corresponding object masks generated by the proposed method. The masks highlight objects like cars, buses, and pedestrians that are considered transient or ephemeral. Red rectangles point out some cases where the segmentation was not successful. The figure demonstrates the method’s robustness to different lighting and weather conditions.

This figure compares the results of the proposed method with five supervised and two unsupervised segmentation methods. The proposed method shows better performance in terms of mask integrity and detail, especially in complex scenes, compared to the other unsupervised methods. It performs similarly to some of the supervised methods, but the supervised methods also show some errors such as incorrect segmentations.

This figure shows the Intersection over Union (IoU) performance of the model over different training iterations for two feature resolutions: 110x180 and 140x210. The graph illustrates that higher resolution (110x180) converges faster and achieves higher IoU. The visualization shows ephemerality masks and feature residuals at various iterations. It demonstrates that more training iterations lead to better segmentation accuracy, but the improvement diminishes after around 4000 iterations.

This figure demonstrates the impact of the number of traversals on the performance of the Emergent Ephemeral Segmentation (EmerSeg) method. Each row shows a different scene from the dataset. The first column displays the original RGB image from that scene. The remaining columns show the segmentation results generated by EmerSeg using 1, 2, 3, 7, and 10 traversals of that scene, respectively. The visualization highlights how increasing the number of traversals improves the accuracy and completeness of the segmentation by providing more information for the model to identify and segment transient objects.

This figure shows an ablation study on the impact of feature dimension on the quality of 2D ephemerality segmentation. It presents RGB images alongside their corresponding ephemerality masks and feature residuals, at four different feature dimensions (4, 8, 16, and 64). The results demonstrate that higher-dimensional features lead to more accurate and detailed object masks, because higher dimensions offer a more discriminative and comprehensive feature representation.

This figure shows an ablation study on the effect of different spatial resolutions on the quality of ephemerality masks and feature residuals generated by the model. As the resolution increases from 25x40 to 110x180, the accuracy and detail of the masks and residuals improve significantly. This demonstrates that higher resolutions provide better feature representation, leading to more accurate object segmentation.

This figure compares the performance of different versions of the DINO model in generating ephemerality masks and feature residuals. It shows that denoising significantly improves the quality of the feature residuals, leading to more accurate masks, while adding a registration module to DINOv2 provides no additional benefit.

This figure compares the 3D point clouds generated using Structure from Motion (SfM) and Gaussian Points after optimization. The left side shows the initial points obtained from SfM, which are scattered and less organized. The right side shows the refined Gaussian points after optimization, resulting in more coherent and precise representation of the scene. This highlights the optimization process in improving the accuracy and clarity of 3D reconstruction.

This figure shows examples of the Mapverse-nuPlan dataset, focusing on locations 1-10 in Las Vegas. Each row displays images of the same location from different traversals, illustrating the variation in appearance across time and highlighting the diversity of urban environments in the dataset. The images show various settings, including city streets with iconic buildings, palm trees, billboards, and varied traffic conditions.

This figure presents a qualitative comparison of environment rendering results using three different methods: 3DGS, 3DGS+SegFormer, and EnvGS (the proposed method). For each method, the figure shows several rendered images alongside the original image. The red circles highlight areas where transient objects are present in the original images, and the comparison helps to visually assess the effectiveness of each method in removing transient objects and rendering a clean environment map.

This figure shows example images from the Mapverse-nuPlan dataset, specifically locations 1 through 10. Each row displays images of the same location captured during five different traversals (out of many), highlighting the variation in environmental conditions, such as time of day and traffic volume. The overall goal is to showcase the diversity and complexity of the urban environment captured by this dataset.
This figure compares the results of the proposed EmerSeg method against other supervised and unsupervised semantic segmentation methods. The comparison highlights EmerSeg’s ability to maintain superior integrity and detail in complex scenarios. While EmerSeg performs similarly to some supervised methods, it significantly outperforms unsupervised methods. Supervised methods show some advantages in identifying fine-grained objects but can also suffer from incorrect segmentations and noise.
This figure shows qualitative results of the proposed method’s ability to segment ephemeral objects in images. It displays several example images alongside their corresponding segmentation masks generated by the algorithm. The results show the method is effective in various lighting and weather conditions and across diverse object categories, but some failure cases, particularly with shadows, are also highlighted.
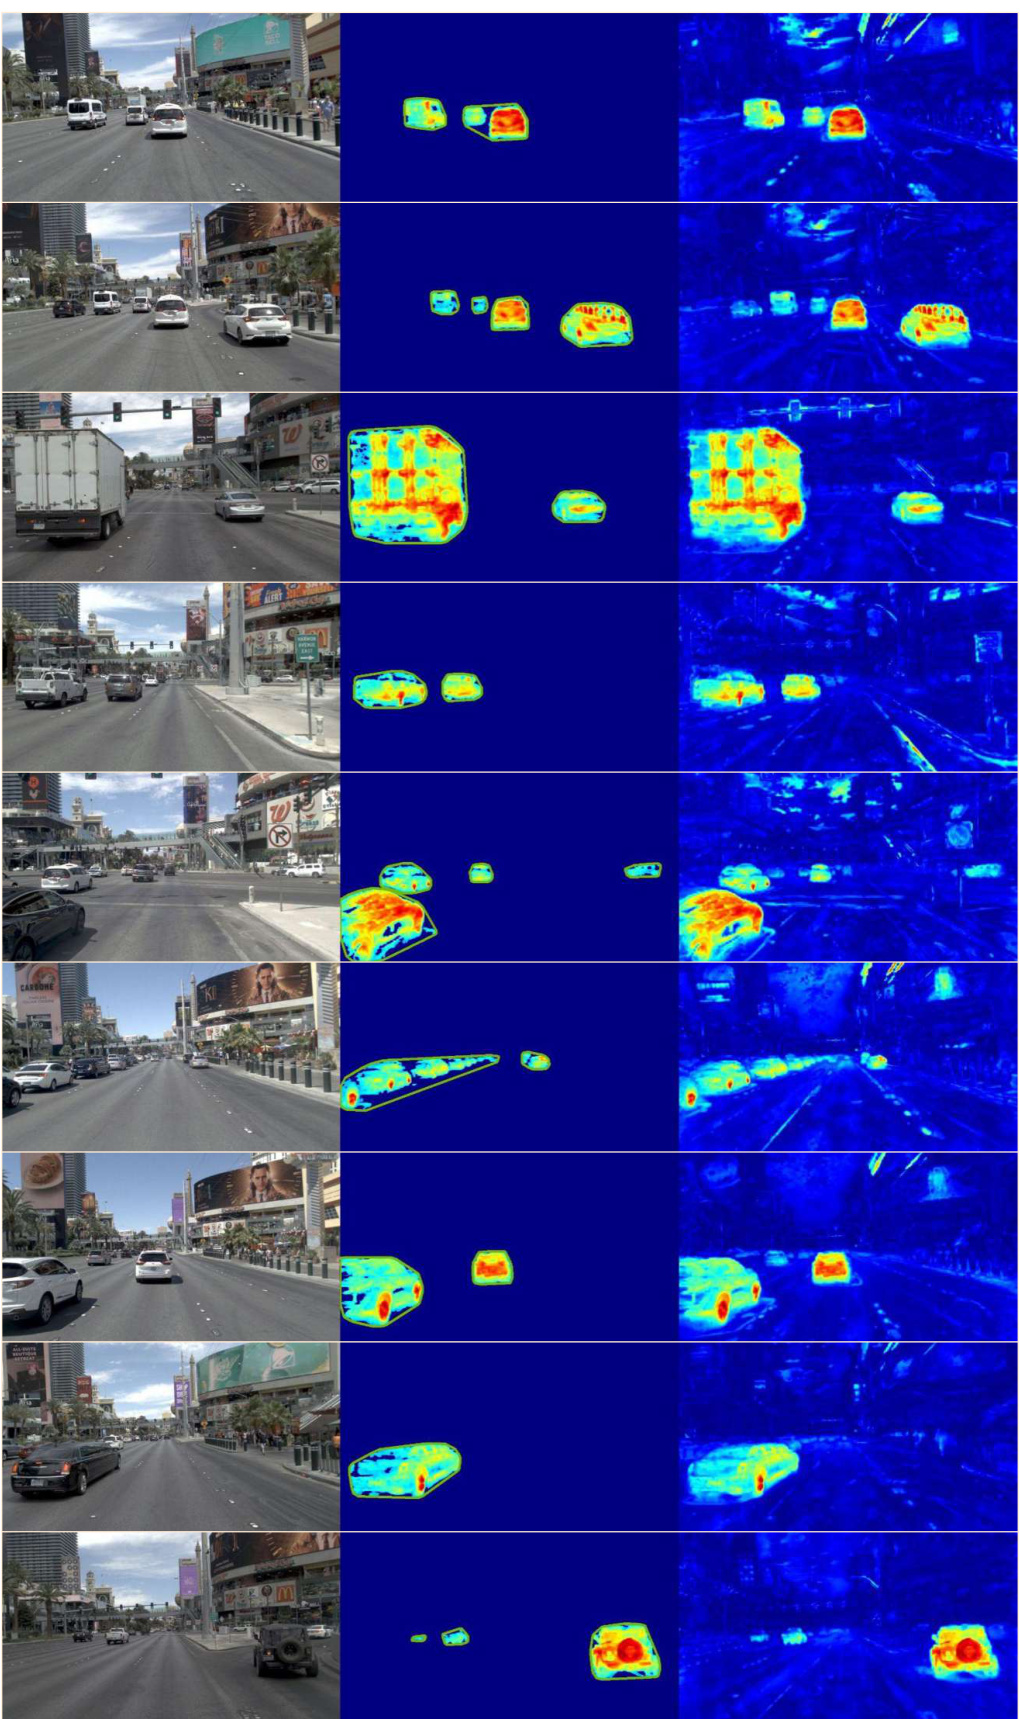
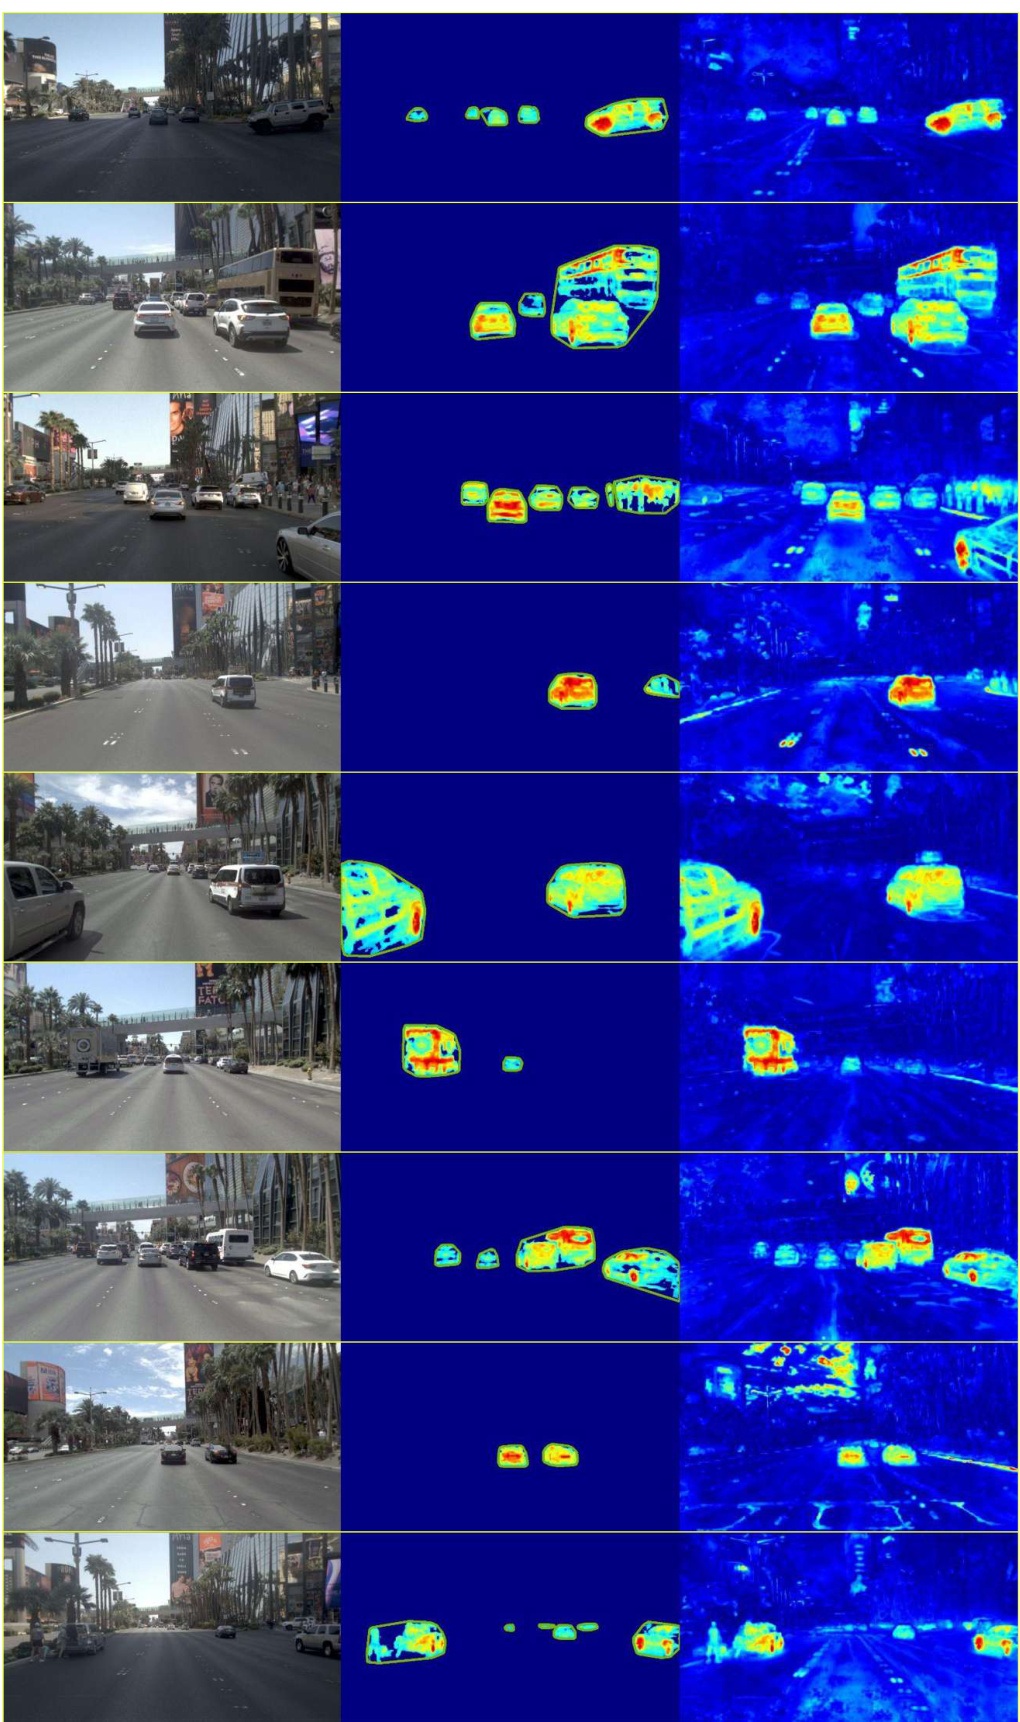
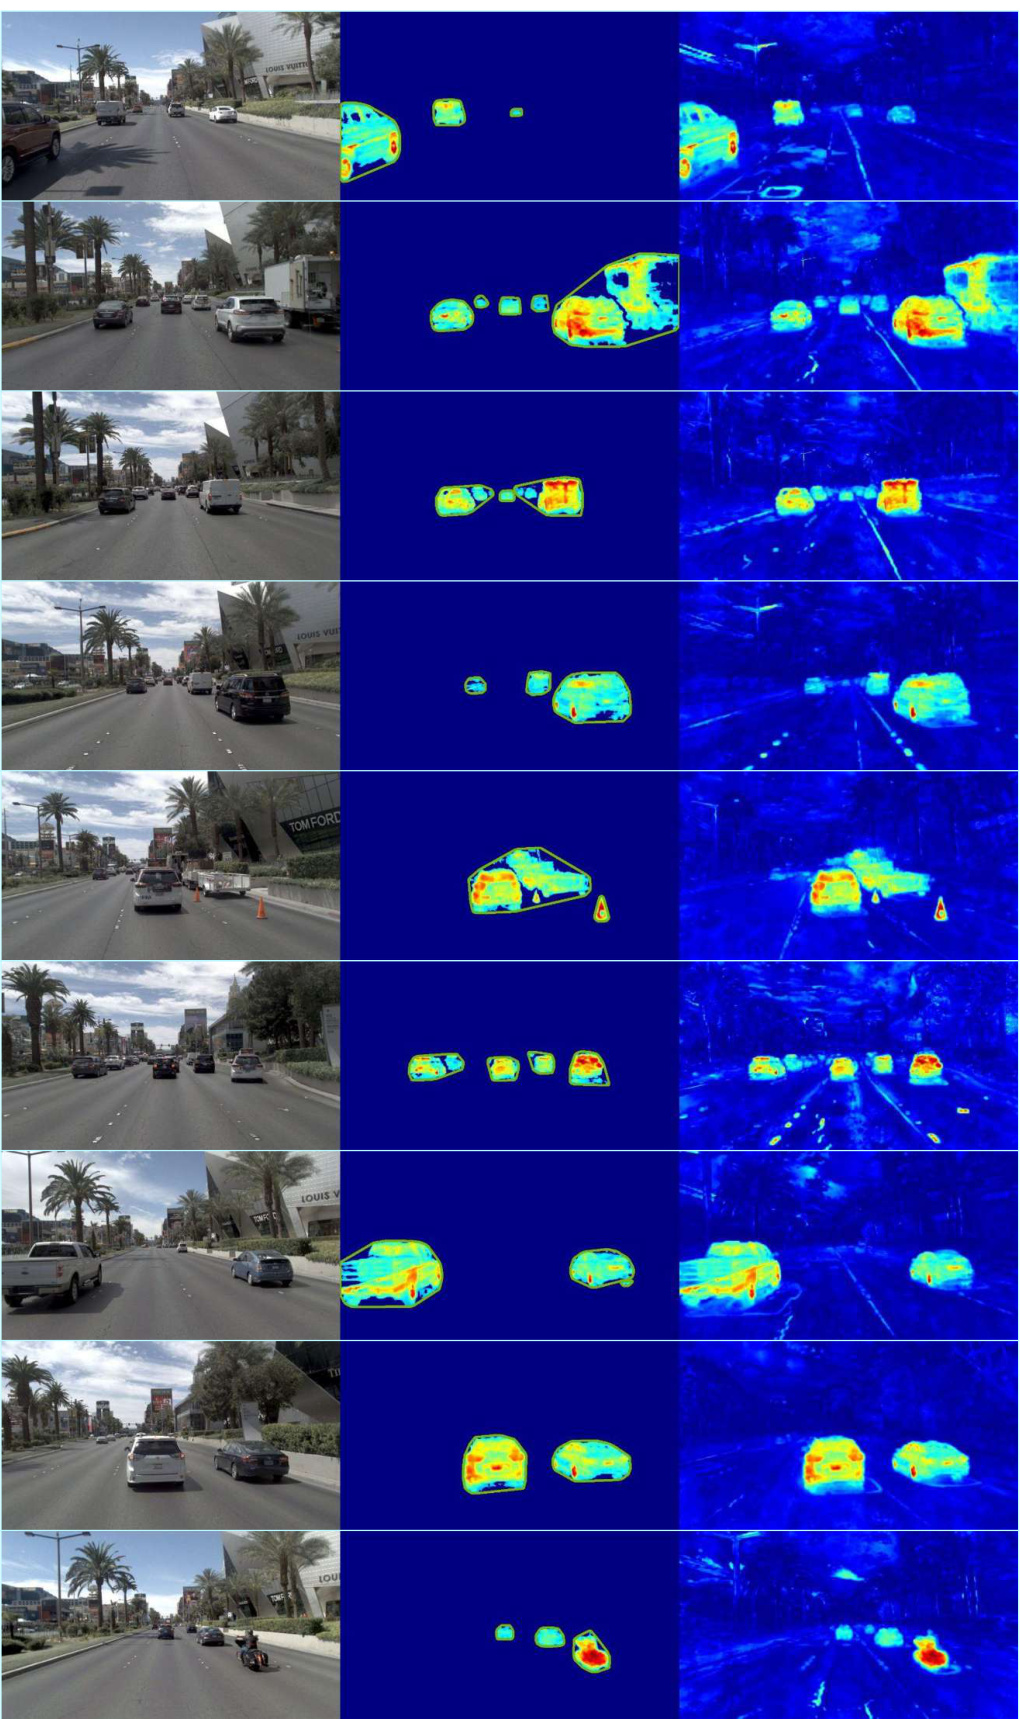
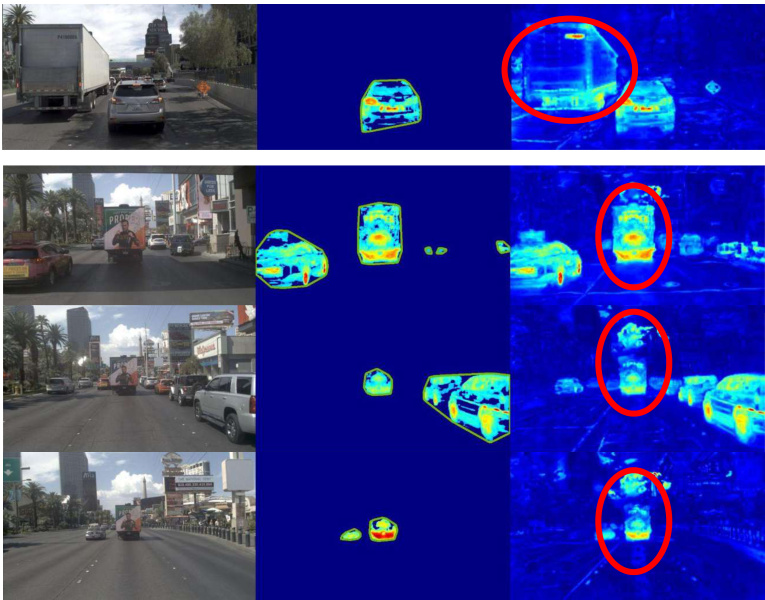
This figure shows a qualitative comparison of the proposed EmerSeg method for unsupervised 2D ephemeral object segmentation. It presents multiple traversals of a single location from the Mapverse-nuPlan dataset. Each row shows a sequence of images from the same location, captured at different times (traversals). The columns depict the original RGB images, the resulting 2D ephemeral object masks generated by EmerSeg, and the normalized feature residual maps. The feature residuals are visualized using a jet colormap, where brighter colors indicate higher feature residuals, likely corresponding to transient objects.
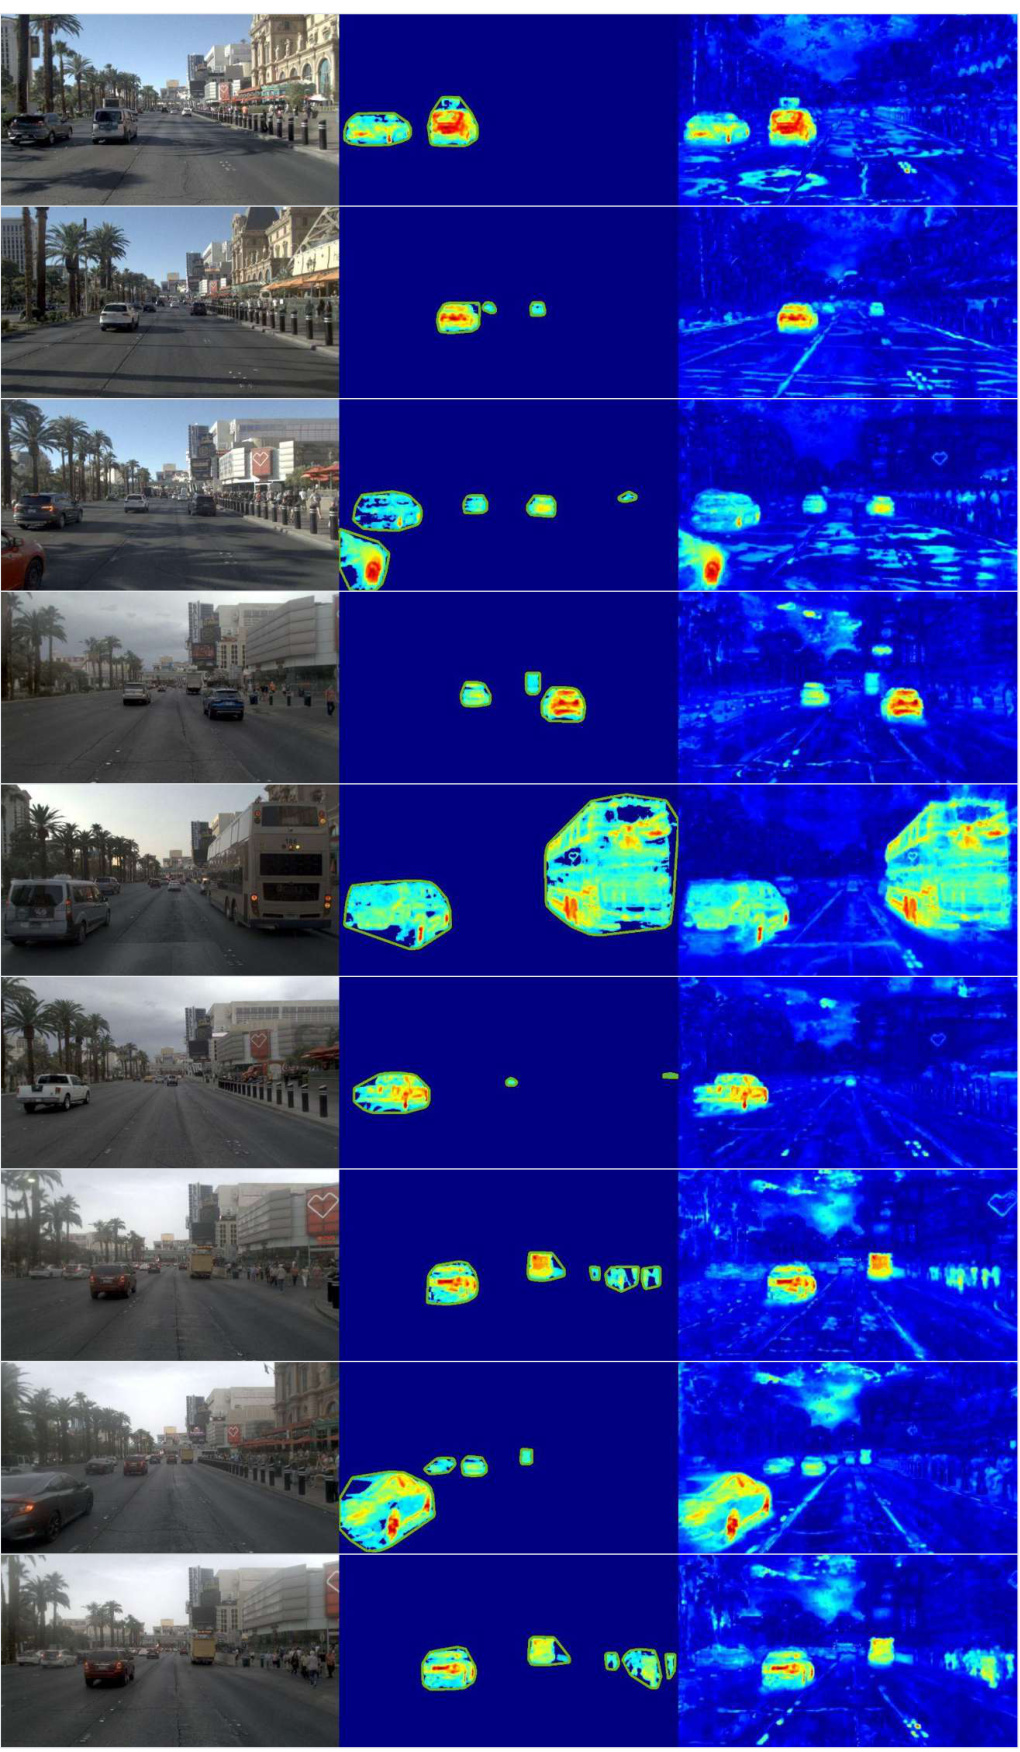
This figure shows the qualitative results of the proposed Emergent Scene Decomposition method (EmerSeg) on location 1 of the Mapverse-nuPlan dataset. It visually compares the original RGB images from multiple traversals with the corresponding 2D ephemeral object masks generated by EmerSeg and the normalized feature residual maps. The jet color map is used to visualize the feature residuals, where higher intensity indicates higher residual values representing transient objects.

This figure visualizes a subset of the Mapverse-nuPlan dataset, showing images from 10 different locations in Las Vegas, each captured across multiple traversals under diverse conditions (lighting, time of day, traffic, etc.). Each row displays images of a single location across several traversals, illustrating the variability and complexity of the urban landscape.

This figure shows the results of the proposed Emergent Scene Decomposition from Multitraverse (3DGM) method on a specific location (location 1) in the Mapverse-nuPlan dataset. The images demonstrate the method’s ability to segment ephemeral objects from a series of images taken at different times across multiple traversals of the same location. The three columns illustrate the input RGB images, the resulting 2D ephemeral object masks, and a visualization of the normalized feature residuals used to help isolate those objects. The jet color map helps to visually represent the residuals, where higher values (warmer colors) indicate a higher likelihood of transient objects.

This figure shows sample images from the Mapverse-nuPlan dataset, specifically locations 11-20. Each row displays images from the same location across multiple drives, illustrating the dynamic nature of the urban environment due to changing traffic, lighting, and time of day. The variety of locations (city streets, intersections, etc.) and conditions is showcased.
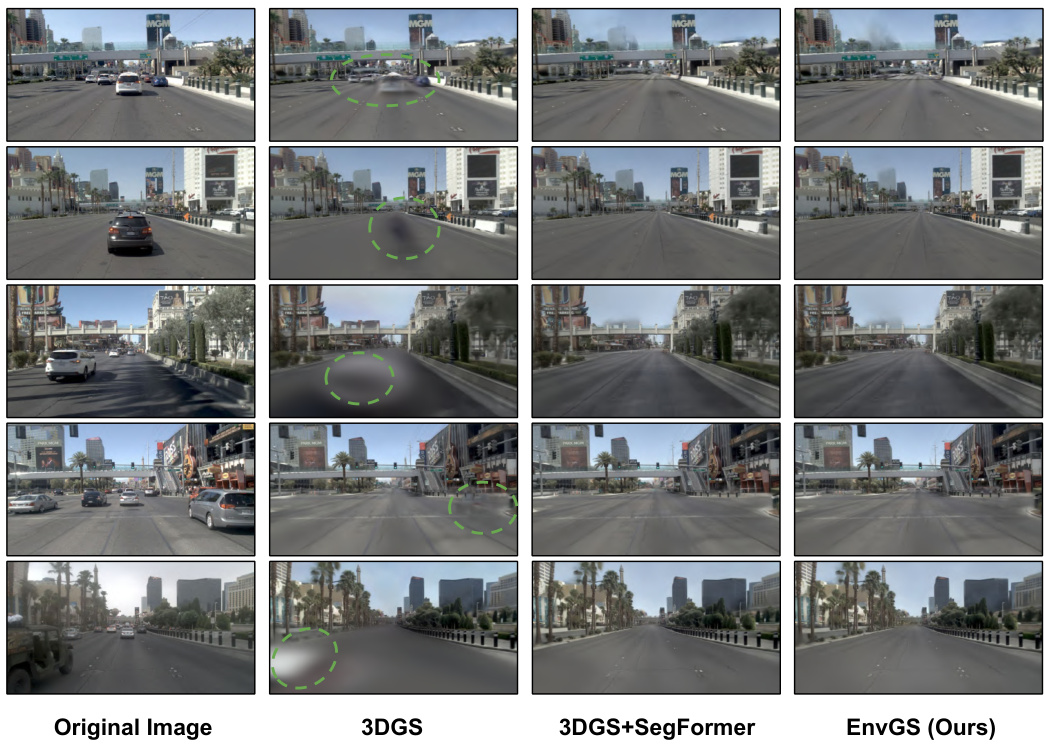
This figure showcases qualitative results of environment rendering using three different methods: 3DGS, 3DGS+SegFormer, and EnvGS (the proposed method). The results demonstrate that the proposed EnvGS method is robust against transient objects and effectively removes object shadows, while outperforming other methods in some cases. Each row shows an original image alongside its renderings from the three methods, highlighting the effectiveness of EnvGS in producing high-quality renderings that accurately reflect the environment without being affected by transient objects and their shadows.

This figure showcases qualitative results of the proposed method’s ability to segment ephemeral objects (e.g., cars, buses, pedestrians) from multi-traverse RGB video sequences. The images demonstrate the method’s robustness across different lighting and weather conditions. Red rectangles highlight instances where the method failed to accurately segment the objects.
This figure shows qualitative results of the 2D ephemeral object segmentation method (EmerSeg). It presents several examples of RGB images from the Mapverse-Ithaca365 dataset alongside their corresponding segmentation masks. The masks highlight objects identified as ephemeral, primarily vehicles and pedestrians. Red rectangles highlight cases where the method struggled to accurately segment objects, while the successful segmentations are shown without special marking. The caption highlights the method’s robustness across various conditions, but also acknowledges some failure cases.

This figure showcases qualitative results of the proposed method’s object mask generation. The results show the method is fairly robust across varying lighting and weather conditions, correctly identifying various object types like cars, buses, and pedestrians. However, red rectangles highlight cases where the method failed, indicating areas for improvement.

This figure shows failure cases of shadow segmentation in the proposed method. Each row represents a different scene. The left column shows the original RGB images; the middle column displays the segmentation output of the proposed method; the right column highlights the areas where shadow removal failed, indicated by red circles. While there are some successful cases marked by green circles, the method lacks consistency across different scenes.
More on tables

This table presents the ablation study results for EmerSeg on the Mapverse-Ithaca365 dataset. It shows the impact of different hyperparameters, including the number of traversals, feature dimension, feature resolution, and feature backbone, on the IoU (Intersection over Union) score, which is a measure of the accuracy of the segmentation. The table is structured to systematically vary each of these hyperparameters while holding others constant, enabling analysis of their individual contributions to the overall performance of EmerSeg. The runtime column indicates the time taken for training with each configuration. The results reveal the optimal settings for achieving high-performance segmentation using EmerSeg.

This table compares the Intersection over Union (IoU) scores of the proposed unsupervised method, EmerSeg, against five state-of-the-art supervised semantic segmentation methods (PSPNet, SegViT, InternImage, Mask2Former, and SegFormer) on the Mapverse-Ithaca365 dataset. The IoU metric measures the overlap between the predicted segmentation masks and ground truth masks. The table demonstrates EmerSeg’s performance in comparison to these supervised models which were pretrained on other datasets and further fine-tuned on Mapverse-Ithaca365, highlighting the effectiveness of the unsupervised approach. The asterisk (*) indicates models that were not trained on the Mapverse-Ithaca365 dataset.

This table compares the Intersection over Union (IoU) scores achieved by the proposed unsupervised method (EmerSeg) against five state-of-the-art supervised semantic segmentation methods on the Mapverse-Ithaca365 dataset. It highlights the performance of EmerSeg, even without supervised training, compared to methods that require extensive human annotation for training. The asterisk (*) indicates methods not trained specifically on the dataset.

This table compares the Intersection over Union (IoU) scores achieved by the proposed unsupervised EmerSeg method against five state-of-the-art supervised semantic segmentation methods (PSPNet, SegViT, InternImage, Mask2Former, and SegFormer) on the Mapverse-Ithaca365 dataset. The IoU metric quantifies the overlap between the predicted segmentation masks and the ground truth masks. The table highlights EmerSeg’s performance relative to supervised methods, demonstrating its capability to achieve competitive results without human annotations during training. The ‘*’ indicates models not trained on the specific dataset used for evaluation.
Full paper#


