↗ OpenReview ↗ NeurIPS Proc. ↗ Chat
TL;DR#
Autonomous driving relies heavily on accurate 3D scene understanding, often achieved through LiDAR sensors. However, existing datasets mostly use single LiDARs and lack data from adverse conditions, limiting the development of robust perception systems. This paper introduces Place3D, a full-cycle pipeline addressing these issues. Place3D tackles the challenges by optimizing LiDAR placement, generating a comprehensive dataset with various conditions and sensor failures, and proposing a novel surrogate metric for evaluation.
Place3D leverages the proposed surrogate metric (M-SOG) and an optimization strategy (CMA-ES) to refine multi-LiDAR placements. It shows significant improvements in LiDAR semantic segmentation and 3D object detection tasks under diverse conditions. This is the first framework investigating multi-LiDAR placement’s impact on 3D scene understanding across diverse conditions, making significant contributions to the field and paving the way for future research.
Key Takeaways#
Why does it matter?#
This paper is crucial for researchers in autonomous driving and 3D perception. It addresses the critical yet under-explored problem of LiDAR placement optimization, offering a novel, systematic framework (Place3D). Place3D provides a valuable benchmark dataset and optimization strategy, enabling researchers to significantly improve the robustness and accuracy of perception systems. The paper’s focus on multi-condition, multi-LiDAR systems reflects a current trend in the field, pushing the boundaries of autonomous driving research. Its findings open new avenues for future studies in sensor placement, data generation, and evaluation methodologies, impacting both algorithm development and hardware design.
Visual Insights#

This figure illustrates the Place3D pipeline, a framework for multi-LiDAR placement optimization. It starts with 3D driving scenes in CARLA (a), which are processed to create probabilistic semantic occupancy grids (P-SOG) (b). The M-SOG metric (c) is then calculated to evaluate the quality of LiDAR placement. Using a CMA-ES optimization (d), the best LiDAR placement is found. A multi-condition multi-LiDAR dataset (e) is used to test the optimized placements’ performance in 3D object detection and semantic segmentation tasks (f).

This table presents the M-SOG (Surrogate Metric of Semantic Occupancy Grids) scores for different LiDAR placements. M-SOG is used to evaluate the quality of LiDAR placements for 3D object detection and semantic segmentation tasks. Lower scores indicate better performance, implying more effective LiDAR placement. The table compares several baseline LiDAR configurations (Center, Line, Pyramid, Square, Trapezoid, Line-roll, Pyramid-roll) with the optimized configuration (‘Ours’). The scores are separated for 3D object detection and 3D semantic segmentation tasks.
In-depth insights#
LiDAR Placement#
Optimizing LiDAR placement for 3D scene understanding is crucial for autonomous driving, as it directly impacts perception accuracy and robustness. Suboptimal placement leads to incomplete data capture, occlusion issues, and reduced sensing efficacy, especially in challenging weather conditions or when sensor failures occur. The research emphasizes the need for a systematic optimization approach, moving beyond heuristic design choices. A full-cycle pipeline involving metric design, optimization algorithms, and comprehensive dataset generation is proposed to tackle this challenge. A novel surrogate metric (M-SOG) is introduced to quantify the quality of LiDAR placements, considering both semantic segmentation and 3D object detection tasks. Experiments show that optimization based on M-SOG significantly improves perception performance over various baselines, highlighting the importance of meticulously selecting sensor configurations for enhanced 3D scene understanding in autonomous driving.
M-SOG Metric#
The proposed M-SOG (Surrogate Metric of Semantic Occupancy Grids) metric offers a novel approach to evaluating LiDAR placement quality for 3D scene understanding. Instead of relying on simple 3D bounding boxes, which can be inaccurate and ignore occlusion, M-SOG leverages semantic occupancy grids, incorporating detailed geometric and semantic information. This allows for a more nuanced understanding of how well different LiDAR configurations capture the scene’s structure and content. By utilizing the entropy of the probabilistic semantic occupancy grid, M-SOG quantifies the uncertainty reduction achieved by a specific LiDAR placement. This makes it particularly suitable for optimization tasks, as it provides a clear and efficient way to compare different configurations and select those that maximize information gain. The metric’s ability to handle diverse conditions and extend to both segmentation and detection tasks makes it a valuable tool for advancing multi-LiDAR perception systems.
Place3D Pipeline#
The Place3D pipeline represents a holistic approach to optimizing LiDAR placement for 3D scene understanding. It cleverly integrates LiDAR placement optimization, data generation using CARLA simulator, and downstream evaluation, addressing the limitations of existing datasets. The pipeline’s core innovation is the introduction of the M-SOG (Surrogate Metric of Semantic Occupancy Grids), an efficient metric to evaluate LiDAR configurations. This metric guides a novel optimization strategy, leveraging CMA-ES, to refine multi-LiDAR placements for enhanced performance in both semantic segmentation and 3D object detection tasks. The framework’s ability to generate data under diverse conditions and its comprehensive evaluation benchmark makes it a valuable contribution towards robust and reliable 3D perception systems. Place3D stands out due to its end-to-end nature, addressing optimization and data limitations simultaneously.
Optimization#
The optimization strategy detailed in this research paper focuses on improving LiDAR placement for enhanced 3D scene understanding. A crucial component is the introduction of a novel surrogate metric, M-SOG, which efficiently evaluates LiDAR placement quality without requiring extensive computational resources. M-SOG leverages semantic occupancy grids to capture the complexities of real-world scenarios, addressing limitations of previous methods. The optimization process itself employs CMA-ES (Covariance Matrix Adaptation Evolution Strategy), an effective algorithm for navigating complex search spaces and finding near-optimal solutions. The paper highlights the importance of a holistic approach, encompassing data generation, optimization, and evaluation, to ensure the optimized LiDAR placement significantly improves downstream perception tasks such as semantic segmentation and 3D object detection, especially under adverse conditions. The results demonstrate that the proposed optimization strategy outperforms various baselines, achieving notable improvements in both accuracy and robustness.
Adverse Robustness#
Adverse robustness in the context of 3D scene understanding using LiDAR focuses on the system’s ability to maintain accuracy and reliability under challenging conditions. This includes dealing with corrupted data due to weather (fog, snow, rain), sensor failures (incomplete echoes, crosstalk), and external disturbances (motion blur). A key aspect is developing algorithms that are not overly sensitive to these imperfections, and techniques such as data augmentation and robust loss functions are relevant. The evaluation of adverse robustness involves testing on datasets that include these challenging scenarios, and designing metrics to quantify performance degradation. Surrogate metrics might be necessary for efficient evaluation, as full training on a large multi-conditional dataset is costly. Optimizing sensor placement (LiDAR configuration) plays a significant role; optimal placements can improve the robustness to adverse conditions.
More visual insights#
More on figures

This figure visualizes different LiDAR placements on an autonomous vehicle. It compares seven baselines inspired by existing self-driving vehicle configurations with two optimized LiDAR placements from the proposed method (one for segmentation and one for detection). An additional placement optimized with a 2D constraint is also shown. The visualizations highlight the spatial distribution of LiDAR sensors on the vehicle’s roof.

This figure illustrates the process of generating Probabilistic Semantic Occupancy Grids (P-SOG) used in the Place3D framework for evaluating LiDAR placements. It starts with raw point cloud data from multiple frames (a), which are merged into a single dense point cloud (b). This dense point cloud is then voxelized into a Semantic Occupancy Grid (SOG) (c), representing the scene’s semantic information in a grid structure. Finally, by considering probabilities across all frames, a Probabilistic SOG (P-SOG) (d) is created, which is used as a more robust and informative representation for LiDAR placement assessment.

This figure illustrates the Place3D pipeline which is composed of 6 stages: 1) 3D driving scenes are generated using CARLA simulator. 2) These scenes are converted to Probabilistic Semantic Occupancy Grids (P-SOG). 3) M-SOG (Surrogate Metric of Semantic Occupancy Grids) is computed using the P-SOG. 4) CMA-ES based optimization is performed using M-SOG to find the optimal LiDAR placements. 5) A multi-condition multi-LiDAR dataset is generated using the optimized LiDAR placements and the CARLA simulator. 6) The performance of different LiDAR placements is evaluated by using the dataset and existing perception models for both 3D object detection and semantic segmentation.

This figure illustrates the Place3D pipeline, a framework for multi-LiDAR placement optimization. It begins with 3D driving scenes (a) from which probabilistic semantic occupancy grids (P-SOG) are generated (b). The M-SOG (Surrogate Metric of Semantic Occupancy Grids) metric (c) is then computed to evaluate LiDAR placement quality. A CMA-ES (Covariance Matrix Adaptation Evolution Strategy) based optimization strategy (d) is used to refine LiDAR placements and maximize the M-SOG score. A multi-condition multi-LiDAR dataset is created and used to evaluate the performance of the optimized placements (e,f) on both clean and corrupted data, using 3D object detection and LiDAR semantic segmentation models.

This figure illustrates the Place3D pipeline, a framework for optimizing LiDAR placement for 3D scene understanding. It starts with synthesizing point clouds in CARLA, then computes a surrogate metric (M-SOG) to evaluate LiDAR placement quality. A CMA-ES optimization strategy refines the placement, which is then validated on a multi-condition, multi-LiDAR dataset for 3D object detection and semantic segmentation tasks. The pipeline demonstrates an end-to-end approach for optimizing multi-LiDAR systems and evaluating their effectiveness.

This figure illustrates the Place3D pipeline, a framework for multi-LiDAR placement optimization. It shows the process from generating synthetic point clouds in CARLA, computing a surrogate metric (M-SOG) to evaluate LiDAR placement quality, optimizing the placements using CMA-ES, creating a multi-condition dataset, and finally evaluating the performance of different placements on 3D object detection and semantic segmentation tasks.

This figure illustrates the Place3D pipeline, a framework for optimizing LiDAR placement for 3D scene understanding. It starts with 3D driving scenes from CARLA, generating probabilistic semantic occupancy grids (P-SOGs). The surrogate metric M-SOG is calculated to evaluate LiDAR placement quality. A CMA-ES optimization strategy refines the LiDAR placement. A multi-condition, multi-LiDAR dataset is used to evaluate the optimized placement’s performance against baselines in semantic segmentation and 3D object detection tasks.

This figure shows six visual examples of LiDAR point clouds in various adverse conditions. Each subfigure demonstrates a different type of corruption: (a) fog, (b) wet ground, (c) snow, (d) motion blur, (e) crosstalk, and (f) incomplete echo. The images illustrate how these adverse conditions affect the quality and completeness of the LiDAR point cloud data, highlighting the challenges in achieving robust 3D perception in real-world scenarios.

This figure shows six examples of LiDAR point clouds that have been corrupted by different types of adverse weather conditions (fog, wet ground, snow), external disturbances (motion blur), and sensor failures (crosstalk, incomplete echo). Each image shows the raw LiDAR point cloud data, highlighting how the different types of corruption affect the quality of the data. This helps illustrate the challenges that adverse conditions pose to autonomous driving and underscores the importance of the Place3D dataset for robust perception research.

This figure illustrates the Place3D pipeline. It starts with generating synthetic 3D driving scenes in CARLA. Probabilistic Semantic Occupancy Grids (P-SOG) are then created, and a surrogate metric (M-SOG) is calculated to evaluate the quality of LiDAR placements. A CMA-ES optimization strategy is used to find optimal LiDAR configurations. Finally, a large-scale multi-condition multi-LiDAR dataset is used to evaluate the performance of the optimized placements compared to baselines on 3D object detection and semantic segmentation tasks.

This figure illustrates the Place3D pipeline, a full-cycle framework for multi-LiDAR placement optimization. It starts with 3D driving scene data from CARLA, which is then processed to create probabilistic semantic occupancy grids (P-SOG). A surrogate metric (M-SOG) is computed to evaluate the quality of LiDAR placements. A CMA-ES optimization strategy is used to find the optimal LiDAR configuration. A large multi-condition, multi-LiDAR dataset is used to evaluate the performance of the optimized configuration in various conditions against baselines. The final evaluation assesses the performance of both 3D object detection and LiDAR semantic segmentation.

This figure illustrates the Place3D pipeline, a framework for multi-LiDAR placement optimization. It starts with 3D driving scenes from CARLA, generating probabilistic semantic occupancy grids. A surrogate metric (M-SOG) evaluates LiDAR placement quality, guiding a CMA-ES optimization process to refine placements. The pipeline includes the generation of a multi-condition, multi-LiDAR dataset to evaluate the optimized placements’ performance in both clean and adverse conditions.

This figure illustrates the Place3D pipeline, a framework for optimizing LiDAR placement in autonomous driving. It starts with 3D driving scenes from the CARLA simulator. These scenes are used to create probabilistic semantic occupancy grids (P-SOGs), which quantify the information captured by LiDARs. A surrogate metric (M-SOG) is calculated from the P-SOGs to evaluate LiDAR placement quality. A CMA-ES optimization strategy refines multi-LiDAR placements to maximize the M-SOG score. Finally, the optimized placements are evaluated on a large-scale dataset under various conditions (clean and adverse) using semantic segmentation and 3D object detection models, demonstrating improved performance compared to baselines.

This figure illustrates the Place3D pipeline, a framework for optimizing LiDAR placement for 3D scene understanding. It starts with generating synthetic data using CARLA, then computes a surrogate metric (M-SOG) to evaluate the quality of different LiDAR placements. A CMA-ES optimization strategy is used to find the optimal placement. Finally, the optimized placement is validated on a large-scale multi-condition dataset by evaluating performance on 3D object detection and LiDAR semantic segmentation tasks. The entire process showcases the optimization of multi-LiDAR placements for improved 3D scene perception.

This figure illustrates the Place3D pipeline, which consists of six main stages: 1) 3D driving scenes are generated using CARLA; 2) probabilistic semantic occupancy grids (P-SOG) are computed; 3) the surrogate metric of semantic occupancy grids (M-SOG) is calculated using the covered voxels; 4) an evolution strategy (CMA-ES) is used to optimize LiDAR placements by maximizing M-SOG; 5) a multi-condition multi-LiDAR dataset is generated and used for training; and 6) perception performance is evaluated on both clean and corrupted data. The diagram visually summarizes the entire workflow of the Place3D framework.
More on tables

This table presents the mean Intersection over Union (mIoU) scores for LiDAR semantic segmentation using different LiDAR placement strategies. The mIoU is a metric evaluating the accuracy of semantic segmentation. Results are shown for both clean and adverse (corrupted) conditions. The average mIoU across various adverse conditions is also provided for each placement strategy.

This table presents the mean Intersection over Union (mIoU) scores for LiDAR semantic segmentation using different LiDAR placement strategies. The performance is evaluated under both clean and six different adverse conditions (fog, wet ground, snow, motion blur, crosstalk, incomplete echo). The table highlights the mIoU for each condition and provides an average mIoU across all adverse conditions for comparison.

This table compares the Place3D dataset with three other popular autonomous driving datasets: nuScenes, Waymo, and SemanticKITTI. The comparison highlights key differences in the number of detection and segmentation classes, the number of 3D bounding boxes and points per frame, the number of LiDAR channels, the vertical field of view of the LiDAR sensors, the LiDAR placement strategy (single vs. multiple), and the presence or absence of adverse weather conditions in the data.

This table presents the performance of LiDAR semantic segmentation using different placement strategies. The mIoU (mean Intersection over Union) scores are reported for both clean and adverse (fog, wet ground, snow, motion blur, crosstalk, incomplete echo) conditions. Higher mIoU indicates better performance. The average mIoU across adverse conditions is also provided for each strategy.

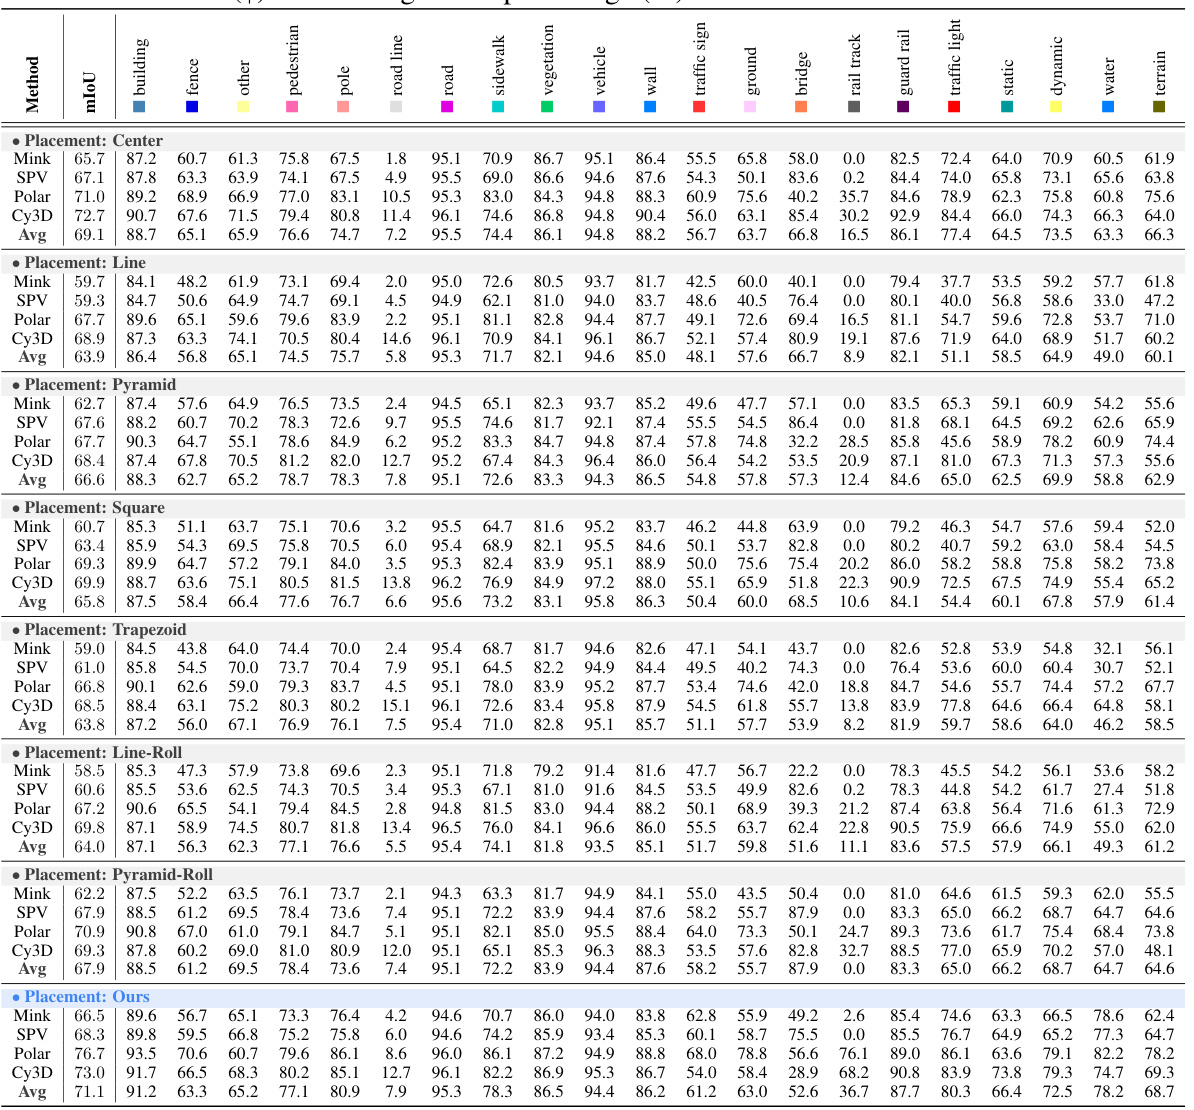
This table presents a detailed breakdown of the performance of four different LiDAR semantic segmentation models (MinkUNet, SPVCNN, PolarNet, and Cylinder3D) across various LiDAR placement strategies. The performance is measured using the mean Intersection over Union (mIoU) and class-wise IoU, both expressed as percentages. The table allows for a comparison of model performance across different LiDAR configurations and highlights strengths and weaknesses of each model in specific semantic categories.

This table presents a detailed breakdown of the performance of four different LiDAR semantic segmentation models (MinkUNet, SPVCNN, PolarNet, and Cylinder3D) across various LiDAR placement strategies. The results are shown as mIoU (mean Intersection over Union) scores and class-wise IoU scores, both expressed as percentages. This allows for a granular analysis of model performance on specific semantic classes under different LiDAR configurations.

This table lists the hyperparameters used for training the four LiDAR semantic segmentation models (MinkUNet, SPVCNN, PolarNet, and Cylinder3D) within the Place3D benchmark. It specifies the batch size, number of epochs, optimizer (AdamW), learning rate, weight decay, and epsilon values for each model. These settings are crucial for understanding and reproducing the experimental results.

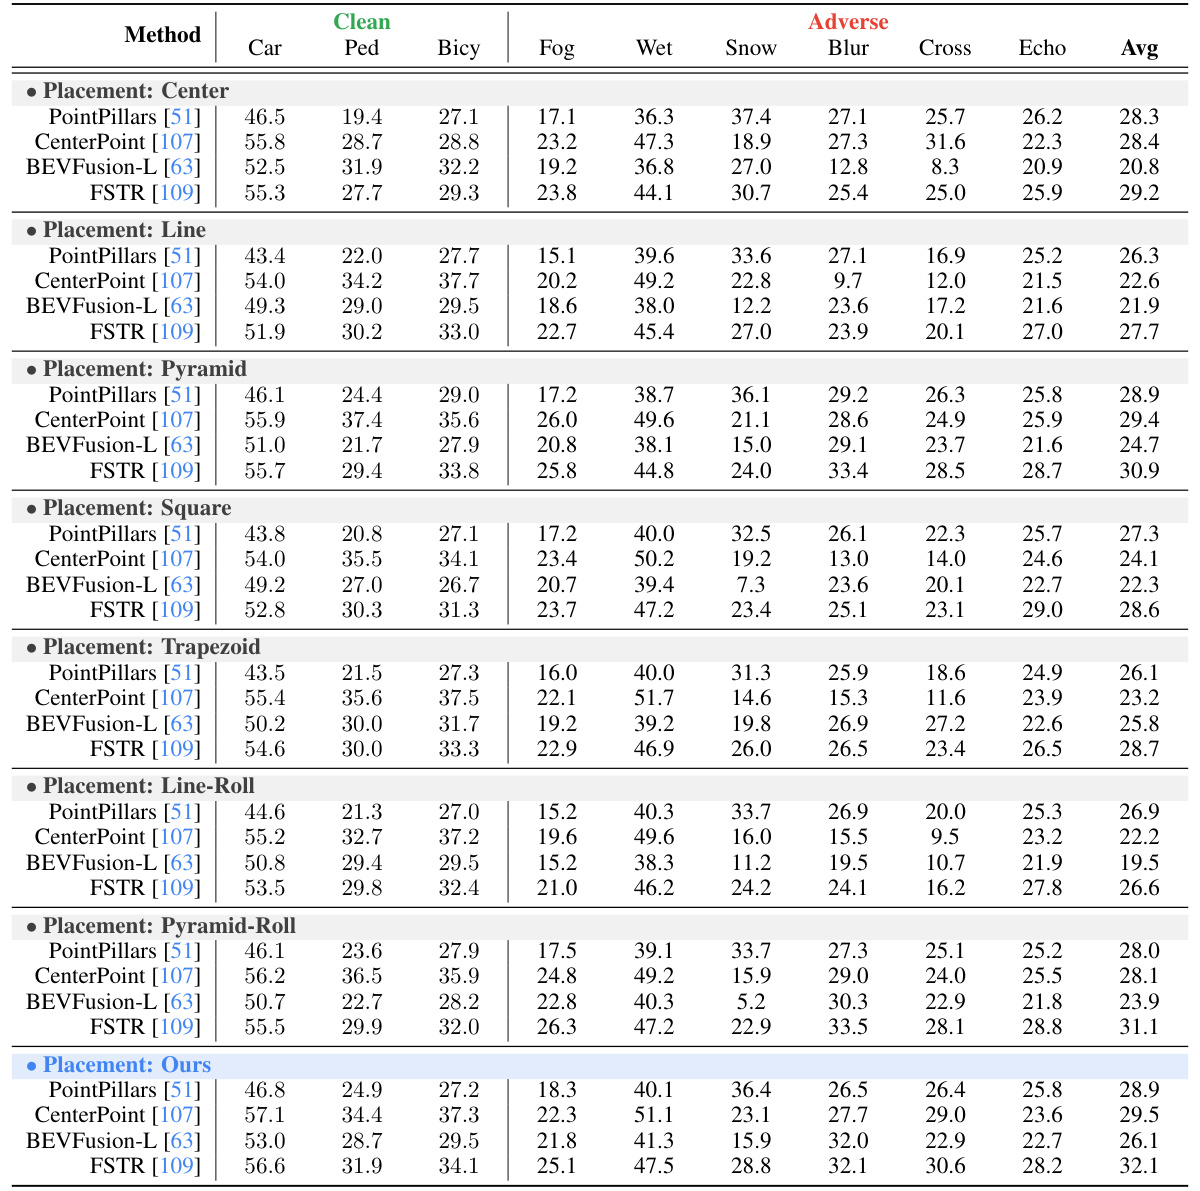
This table presents the hyperparameters used for training the four 3D object detection models (PointPillars, CenterPoint, BEVFusion-L, and FSTR) within the Place3D benchmark. It details the batch size, number of epochs, optimizer (AdamW), learning rate, weight decay, and epsilon values used for each model.

This table compares four different methods for optimizing LiDAR sensor placement for autonomous driving, highlighting key differences in venue, deployment type (vehicle-mounted vs roadside), sensor type, prior information used, the tasks addressed (detection or segmentation), and whether the method includes optimization. Place3D is shown to be unique in optimizing for both semantic segmentation and detection, and utilizing semantic occupancy as prior information.

This table presents the mean Intersection over Union (mIoU) scores for LiDAR semantic segmentation using different LiDAR placement strategies. It compares performance across various models (MinkUNet, SPVCNN, PolarNet, Cylinder3D) under both clean and adverse weather conditions (fog, wet ground, snow, motion blur, crosstalk, incomplete echo). The mIoU, a measure of semantic segmentation accuracy, is reported as a percentage. Average mIoU scores across the adverse conditions are also provided for each strategy.

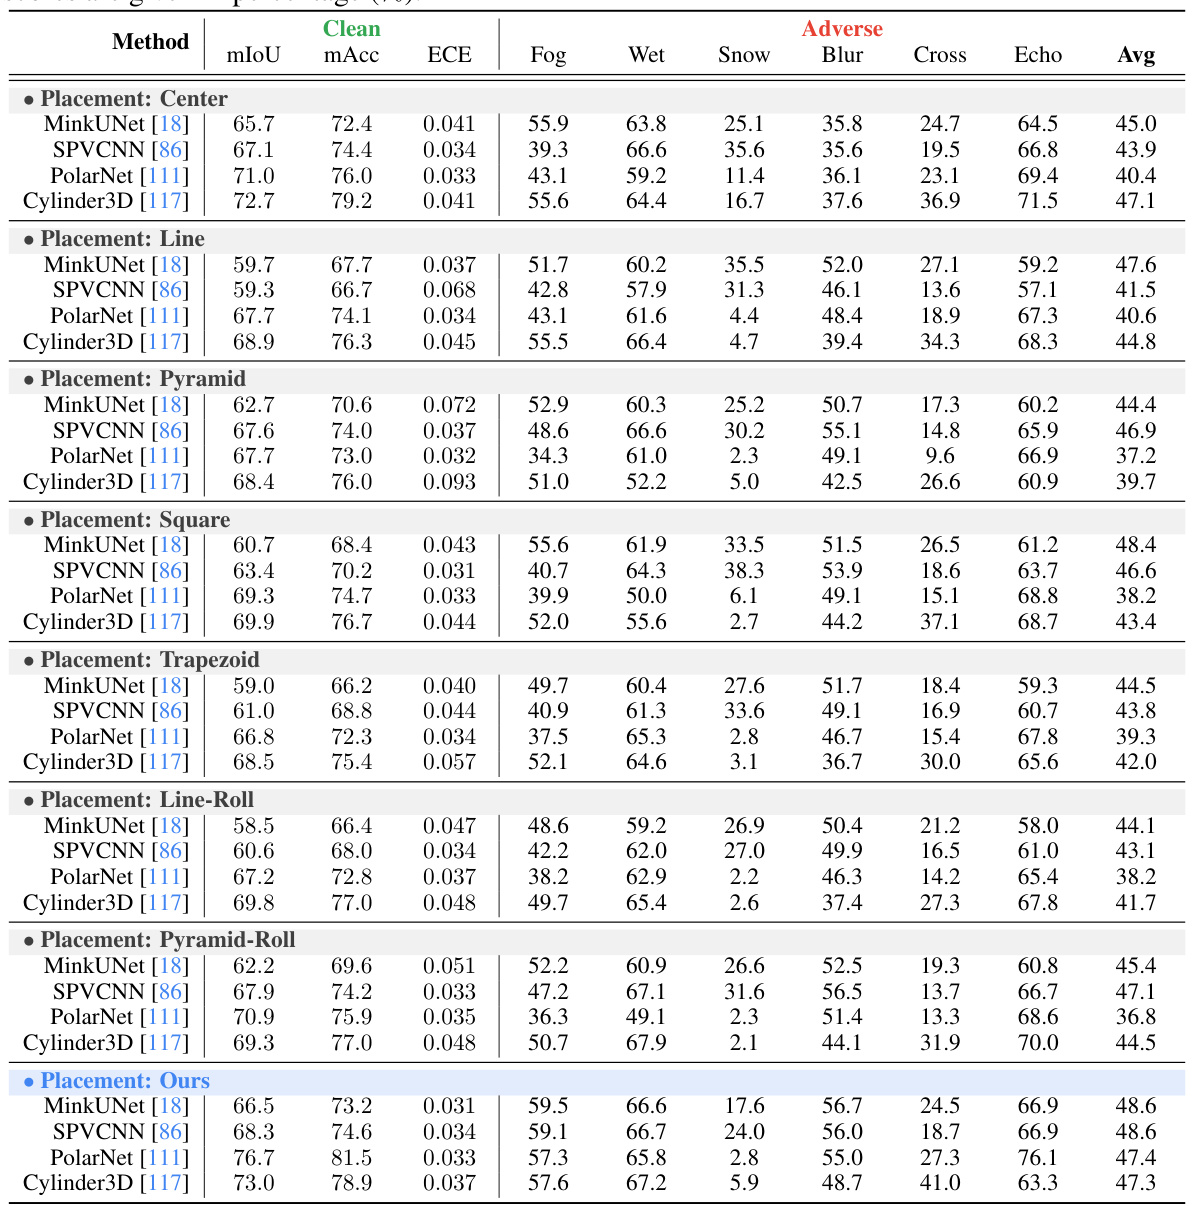
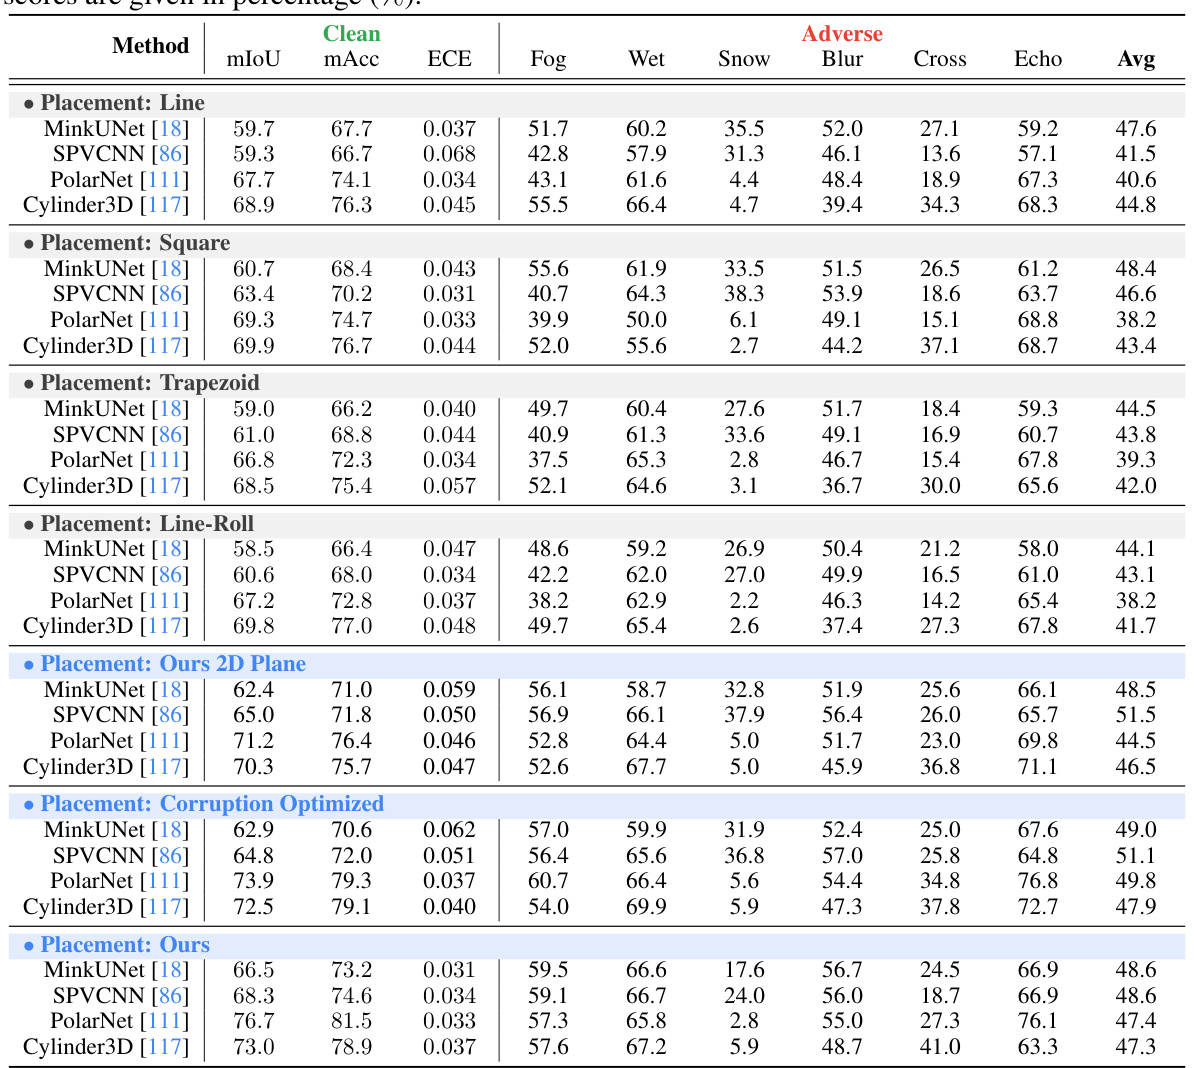
This table presents the performance evaluation results of LiDAR semantic segmentation using different LiDAR placement strategies under both clean and adverse conditions. The metrics used are mean Intersection over Union (mIoU), mean Accuracy (mAcc), Expected Calibration Error (ECE), and average mIoU across adverse conditions. Higher mIoU and mAcc values indicate better performance, while a lower ECE value signifies better calibration. The table allows comparison of various LiDAR placement strategies across different adverse weather and sensor failure conditions.

This table presents the mean Intersection over Union (mIoU) scores for LiDAR semantic segmentation using different LiDAR placement strategies. The mIoU is a metric evaluating the accuracy of semantic segmentation. The results are shown for both clean conditions (no added noise or weather effects) and for several adverse conditions (fog, wet ground, snow, motion blur, crosstalk, incomplete echo). The average mIoU score across the adverse conditions is also provided for each strategy, allowing for a comparison of robustness.

This table presents the performance of four different LiDAR semantic segmentation models (MinkUNet, SPVCNN, PolarNet, and Cylinder3D) under various LiDAR placement strategies. The results are broken down by performance metric (mIoU, mAcc, ECE) for both clean and adverse conditions (fog, wet ground, snow, motion blur, crosstalk, and incomplete echo). The table allows for a comparison of model performance under various conditions and LiDAR placements.
Full paper#


