↗ OpenReview ↗ NeurIPS Proc. ↗ Chat
TL;DR#
Current transcriptome foundation models (TFMs) treat single cells independently, ignoring valuable taxonomic relationships between cell types. This limitation hinders the models’ ability to capture biologically meaningful gene co-expression patterns and generalize across diverse datasets. Effectively leveraging cell ontology information during TFM pre-training is crucial for overcoming this limitation.
To address this, the researchers developed scCello, a novel cell ontology-guided TFM. scCello incorporates cell-type coherence and ontology alignment losses into the pre-training process. This innovative approach enables scCello to learn biologically meaningful patterns while maintaining its general-purpose nature. The model demonstrated superior performance in various downstream tasks, including novel cell type classification, marker gene prediction, and cancer drug response prediction, surpassing existing TFMs in accuracy and generalizability.
Key Takeaways#
Why does it matter?#
This paper is highly important for researchers in single-cell genomics and machine learning. It introduces scCello, a novel foundation model that effectively leverages cell ontology information to improve the accuracy and generalizability of transcriptome analysis. This work is relevant to the growing trend of using foundation models for biological data analysis, opening up new avenues for research into novel cell type classification and marker gene prediction. The superior performance of scCello on benchmark datasets demonstrates its potential impact for various downstream tasks.
Visual Insights#

This figure illustrates the key components of the scCello model. Panel (a) shows the cell ontology graph, representing the hierarchical relationships between cell types. Panel (b) depicts the input data: scRNA-seq data with gene expression information and corresponding cell type labels. Panel (c) details the scCello pre-training framework, highlighting three levels of objectives: masked gene prediction at the gene level, intra-cellular ontology coherence, and inter-cellular relational alignment. Panel (d) summarizes the downstream tasks enabled by scCello, including cell type clustering, batch integration, cell type classification, novel cell type classification, marker gene prediction, and cancer drug prediction.

This table presents the results of a zero-shot cell type clustering experiment performed on both in-distribution (ID) and out-of-distribution (OOD) datasets. The results are compared across various methods, including non-TFM methods (Raw Data, Seurat, Harmony, scVI), ontology-agnostic TFMs (Geneformer, scGPT, scTab, UCE, MGP, Sup, MGP+Sup), and the ontology-enhanced TFM scCello. The metrics used to evaluate performance are NMI, ARI, ASW, and AvgBio, which are calculated for both the ID and OOD datasets. The OOD datasets include variations of unseen cell types, unseen tissues, and unseen donors to assess generalization capability.
In-depth insights#
Cell Ontology’s Role#
The integration of cell ontology significantly enhances the capabilities of transcriptome foundation models (TFMs). Cell ontology provides a structured representation of cell types and their hierarchical relationships, which TFMs can leverage to learn biologically meaningful gene co-expression patterns. By incorporating this information, TFMs are no longer limited to treating cells as independent samples. Instead, they can learn cell representations that reflect both the cell type and its relationships with other cell types. This allows the model to better understand the biological context of gene expression. The benefits of using cell ontology are demonstrated by improvements in downstream tasks such as cell-type identification, novel cell-type classification, and marker gene prediction. The integration of cell ontology improves the generalizability and transferability of TFMs making them more robust and applicable to diverse datasets.
scCello Pre-training#
scCello’s pre-training integrates cell ontology information to enhance cell representation learning. Three levels of objectives guide this process: masked gene prediction to learn gene co-expression patterns; intra-cellular ontology coherence loss to encourage similar cell types to cluster together; and inter-cellular relational alignment to ensure cell embeddings align with their ontology relationships, leveraging Personalized PageRank scores. Cell-type coherence and ontology alignment losses, combined with the standard masked gene prediction loss, are crucial for scCello’s superior performance. This multifaceted approach is key to learning biologically meaningful representations and shows the value of incorporating prior biological knowledge into foundation model training. The approach demonstrably improves scCello’s generalization and transferability compared to other transcriptome foundation models.
Downstream Tasks#
The ‘Downstream Tasks’ section of a research paper would detail the various applications and analyses performed using the model developed in the study. Given the context of a transcriptome foundation model (TFM) like scCello, these tasks would likely focus on leveraging the model’s learned representations of cells and genes for biological discovery. Examples of downstream tasks could include cell type identification (classifying cells into known or novel types), marker gene prediction (identifying genes specific to certain cell types), drug response prediction (predicting how cells will respond to specific drugs), and batch effect correction (removing technical variation between datasets). The success of these tasks would demonstrate the generalizability and transferability of the TFM, highlighting its ability to perform well on data not seen during training. Furthermore, the section might include a discussion on how the TFM’s performance on these downstream tasks compares to other existing methods, quantifying the improvements achieved through the integration of cell ontology information during the model’s pre-training phase. Overall, this section would serve as crucial validation of the model’s utility and biological relevance.
Ablation Study#
An ablation study systematically removes components of a model to assess their individual contributions. In this context, an ablation study on a cell ontology guided transcriptome foundation model (TFM) would likely involve removing one of the loss functions (masked gene prediction, intra-cellular ontology coherence, or inter-cellular relational alignment) during pre-training. By comparing the performance of the full model against these ablated versions on downstream tasks (like cell type classification or marker gene prediction), researchers can quantify the impact of each component. The results would reveal which components are crucial for the model’s success and highlight the effectiveness of the cell ontology integration. Such findings could guide future model development by informing design choices and resource allocation. A key insight might concern the relative importance of gene co-expression pattern learning versus cell ontology knowledge in achieving high performance. This could involve finding whether one loss is more crucial than others or if synergistic interactions exist between loss functions.
Future Work#
The authors acknowledge several avenues for future investigation. Improving the efficiency of scCello’s fine-tuning process is crucial, ideally enabling continual learning to adapt to the ever-evolving cell ontology. Scaling up scCello’s model size is another key area, potentially unlocking greater expressiveness and capacity for more complex biological tasks. Addressing limitations in the zero-shot marker gene prediction, such as the identification of essential genes, requires further investigation. Finally, the high computational cost of pre-training necessitates exploration of more efficient training strategies and approaches to mitigate the environmental impact. Addressing these points will significantly enhance scCello’s capabilities and broader applicability.
More visual insights#
More on figures

This figure demonstrates the performance of scCello and other methods in classifying novel cell types. The x-axis shows the proportion of novel cell types (10%, 25%, 50%, 75%, 100%) used in the test dataset. The y-axis shows the accuracy of the different methods in classifying these novel cell types. The figure illustrates the superior generalization ability of scCello compared to other methods, especially as the difficulty increases (i.e., higher proportion of novel cell types). Error bars are included to show variability in performance.

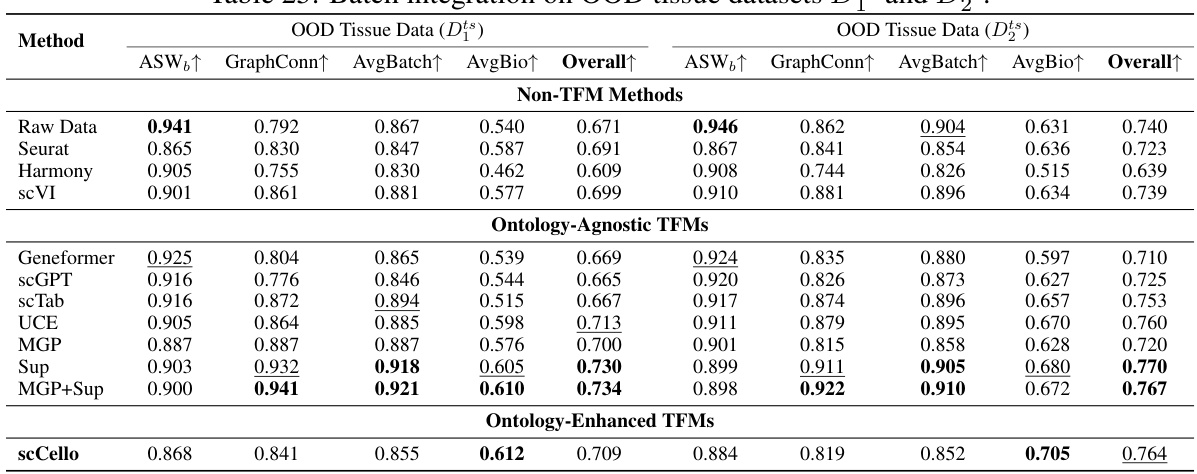
This figure shows the performance of scCello and various baselines on the batch integration task using the Overall score as a metric. The Overall score combines AvgBio (averages of Normalized Mutual Information, Adjusted Rand Index, and average Silhouette Width) and AvgBatch (averages of ASW and Graph Connectivity) to balance biological relevance and batch consistency. The results demonstrate scCello’s robustness to batch effects across different datasets.

This figure provides a comprehensive overview of the scCello model. Panel (a) shows the cell ontology graph, which represents the hierarchical relationships between different cell types. Panel (b) illustrates the input data: scRNA-seq data, where each cell is represented by a sequence of gene expressions and associated with a cell type label. Panel (c) details the scCello pre-training framework, which incorporates three levels of objectives: masked gene prediction, intra-cellular ontology coherence, and inter-cellular relational alignment. These objectives guide scCello to learn gene co-expression patterns, cell type-specific representations, and relationships between cell types from the cell ontology graph. Finally, Panel (d) summarizes the downstream tasks enabled by the pre-trained scCello model, including cell type clustering, classification, and prediction of marker genes and drug responses.

This figure compares the distributions of the Personalized PageRank (PPR) scores and the transformed structural similarity scores. The PPR scores, representing the probability of a random walk starting from a target node and ending at another node in the cell ontology graph, show a skewed distribution concentrated at lower magnitudes. The transformation applied to the PPR scores (shown in Equation 3 of the paper) results in a less-skewed distribution of structural similarity scores, making it easier to distinguish between similar and dissimilar cell types and facilitating the incorporation of ontology relationships into the TFM pre-training process. The transformation helps mitigate the effects of noise and uneven magnitudes in the raw PPR scores.
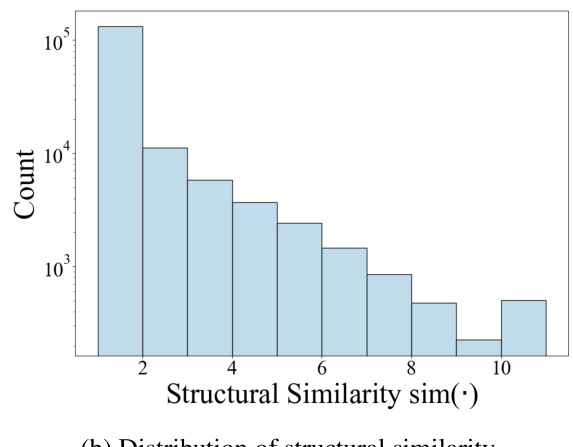
This figure compares the distributions of Personalized PageRank (PPR) scores and the transformed structural similarity scores (sim). The PPR scores are obtained directly from the PPR algorithm applied to the cell ontology graph. The sim scores are derived from the PPR scores through a transformation process (described in the paper) to mitigate numerical noise, skewed distributions, and enhance the differences between similar and dissimilar cell types. This transformation is crucial for using the similarity information effectively in the scCello model training. The figure shows that the transformed structural similarity sim(·) has a more balanced distribution and avoids overemphasizing small differences.

This figure compares the distributions of PPR scores and structural similarity scores before and after a transformation. The PPR scores, obtained from the Personalized PageRank algorithm, represent the structural similarity between cell types in the cell ontology graph. The original PPR scores show a skewed distribution, concentrated around lower values. However, after applying a transformation (described in Eqn. 3 of the paper) this distribution becomes less skewed and more clearly discretized. This transformation improves the algorithm’s ability to distinguish between similar and dissimilar cell types, making it more suitable for use in the pre-training of the transcriptome foundation model (TFM). The transformation involves applying a logarithmic scaling and discretization to the raw PPR scores to reduce the effects of noise and skewed magnitudes. This processed structural similarity is then used in the relational alignment loss of the model.

This figure compares the distributions of PPR scores (a measure of structural similarity between cell types derived from the Personalized PageRank algorithm) before and after a transformation applied in scCello. The transformation addresses issues such as numerical noise and skewed distributions in the raw PPR scores. The transformed structural similarity, sim(·), is shown to have a less skewed distribution, making it more suitable for use in the scCello pre-training framework, especially in the relational alignment loss calculation. The plot highlights the effect of the transformation on improving the clarity and usability of the structural similarity measure for downstream tasks.

This figure provides a comprehensive overview of the scCello model. Panel (a) shows the cell ontology graph used to incorporate cell type relationships into the model’s pre-training. Panel (b) illustrates the input data, consisting of scRNA-seq data with gene expression levels and corresponding cell type ontology identifiers. Panel (c) details the scCello pre-training framework, which incorporates three levels of objectives: masked gene prediction, intra-cellular ontology coherence, and inter-cellular relational alignment. These objectives guide the model to learn meaningful gene co-expression patterns and cell type relationships. Finally, panel (d) outlines the downstream tasks enabled by scCello, including cell type clustering, batch integration, novel cell type classification, and prediction of cell-type specific marker genes and drug responses.

This figure shows the performance of scCello and other methods on classifying novel cell types in out-of-distribution (OOD) datasets. The x-axis represents the percentage of novel cell types in the test dataset, ranging from 10% to 100%. The y-axis shows the accuracy (Acc) and macro F1 score, which are used to evaluate the performance of the classification task. The figure demonstrates the superiority of scCello in handling the novel cell types, showcasing its superior generalization ability compared to other methods. The two plots show the evaluation metric accuracy and macro F1 score respectively.
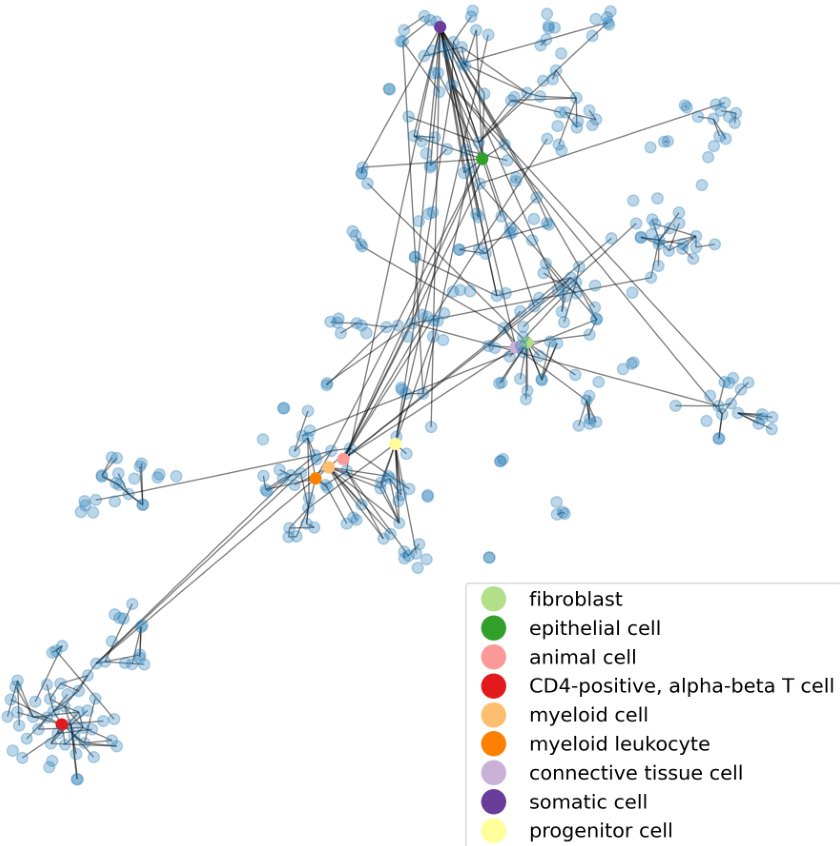
This figure illustrates the overall architecture of the scCello model and its training process. Panel (a) shows a cell ontology graph representing relationships between different cell types. Panel (b) depicts the input scRNA-seq data, where each cell is associated with a cell type. Panel (c) details the three-level pre-training framework of scCello: gene-level masked prediction, intra-cellular ontology coherence, and inter-cellular relational alignment. Finally, panel (d) summarizes the downstream tasks performed using the pre-trained model.
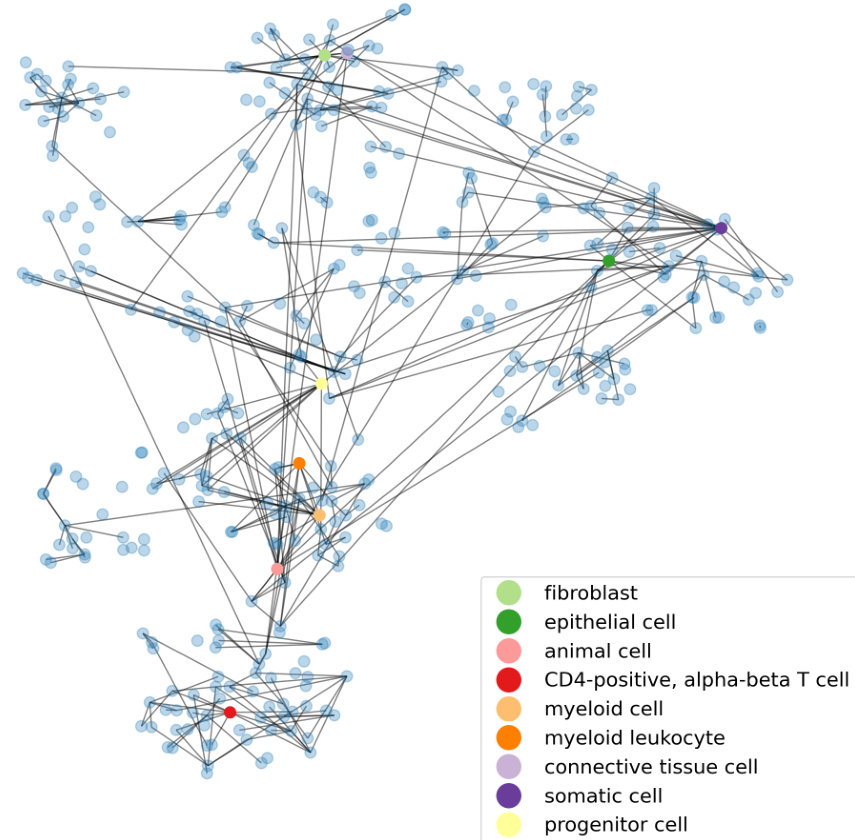
This figure provides a comprehensive overview of the scCello model. Panel (a) shows the cell ontology graph representing the hierarchical relationships between different cell types. Panel (b) illustrates the input data: scRNA-seq data, where each cell is associated with a cell type ontology identifier and represented by a sequence of genes. Panel (c) details the three-level pre-training framework of scCello: gene-level masked gene prediction, intra-cellular ontology coherence, and inter-cellular relational alignment. Each level aims to learn different aspects of the transcriptomic data. Finally, panel (d) summarizes the downstream tasks enabled by the pre-trained scCello model, including cell type clustering, batch integration, novel cell type classification, marker gene prediction, and cancer drug prediction.
More on tables

This table presents the results of cell type identification experiments using fine-tuned Transcriptome Foundation Models (TFMs). It compares the performance of various TFMs, including scCello (the model introduced in the paper), on a specific dataset (‘ID dataset Did’). The evaluation includes both classification accuracy (how well the models correctly identify cell types) and clustering performance (how well the models group similar cells together). The table allows a comparison of the performance of scCello against other models, both those that incorporate cell ontology information and those that do not.
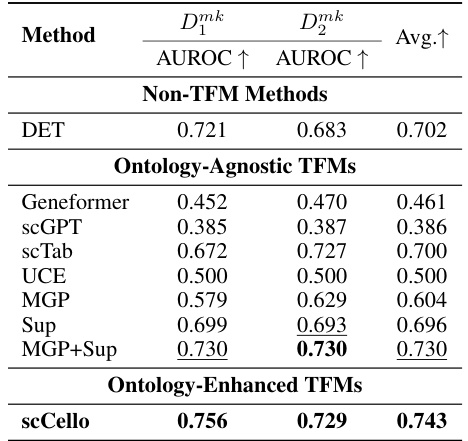
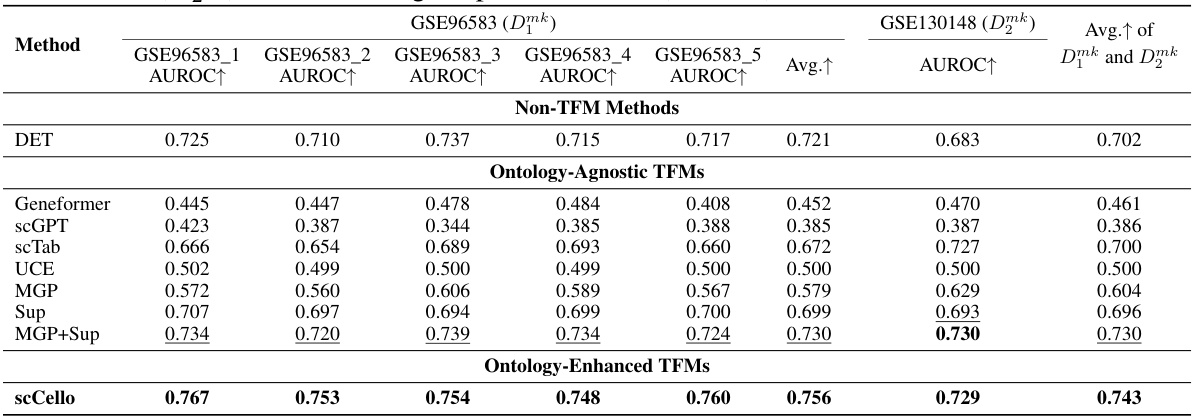
This table presents the results of a binary classification task aimed at identifying cell-type-specific marker genes. Multiple methods, including both traditional methods and transcriptome foundation models (TFMs), were evaluated using AUROC (Area Under the Receiver Operating Characteristic) scores on two datasets: Dmk1 and Dmk2. The AUROC scores indicate the performance of each method in distinguishing between marker genes and non-marker genes. Higher AUROC values indicate better performance.

This table presents the Pearson Correlation Coefficient (PCC) scores achieved by various transcriptome foundation models (TFMs) and non-TFM methods in predicting the half-maximal inhibitory concentration (IC50) values for cancer drugs. Higher PCC values indicate stronger correlations and better predictive performance. The table compares the performance of scCello (the proposed model) against existing TFMs (scFoundation, Geneformer, scGPT, scTab, UCE, MGP, Sup, MGP+Sup) and non-TFM methods (DeepCDR).

This table presents the results of an ablation study on the scCello model, showing the impact of removing each of the four pre-training loss components individually (LMGP, LInter, LIntra, LReg). It compares the performance on cell type clustering (AvgBio metric for ID and OOD datasets) and novel cell type classification (Acc and Macro F1 metrics for OOD datasets). The second part of the table (Table 6) shows the parameter efficiency of scCello compared to other TFMs (Geneformer, scGPT, scTab, UCE, MGP, Sup, MGP+Sup).

This table demonstrates the relationship between structural similarity scores (sim(.)) and the corresponding cell types, illustrating how the ontology-enhanced TFM, scCello, captures biologically meaningful relationships. Higher sim(.) scores indicate closer relationships in the cell ontology. The table provides examples for both T cells and neurons, showing increasingly specific cell types as the sim(.) score increases.

This table presents a detailed breakdown of the datasets used in the study. It shows the number of cells, cell types, tissues, donors, conditions, and batches for the pre-training dataset and six out-of-distribution (OOD) datasets. The OOD datasets are further categorized into three scenarios: unseen cell types, unseen tissues, and unseen donors, each having two datasets. The table highlights the disjoint nature of certain dataset categories. For instance, the cell types in the pre-training set are different from the cell types in the OOD cell type datasets.

This table compares the hyperparameters used for training various transcriptome foundation models (TFMs), including the proposed scCello model and several existing models like Geneformer, scGPT, scTab, and UCE. The comparison covers aspects such as the number of parameters, computational resources used (number of GPUs, training time), sequence length, gene masking ratio, batch size, gradient accumulation steps, effective batch size, cell representation methods, gene token vocabulary size, number of transformer layers, hidden dimension, embedding size, number of transformer heads, activation functions used, and dropout rate. This detailed comparison helps to understand the differences in model architecture and training strategies among the various TFMs.

This table presents the results of zero-shot cell type clustering experiments conducted on both in-distribution (ID) and out-of-distribution (OOD) datasets. The results are compared across various methods, including non-TFM methods (Raw Data, Seurat, Harmony, scVI), ontology-agnostic TFMs (Geneformer, scGPT, scTab, UCE, MGP, Sup, MGP+Sup), and the ontology-enhanced TFM (scCello). Multiple metrics are used to assess performance, including Normalized Mutual Information (NMI), Adjusted Rand Index (ARI), Average Silhouette Width (ASW), and the average of these three scores (AvgBio). The OOD datasets cover several scenarios, such as unseen cell types (Dct, Dts), unseen tissues (Dts), and unseen donors (Dan). The table allows for a comparison of the generalization abilities of different methods across various data distributions and conditions.

This table presents the detailed zero-shot cell type clustering results on two out-of-distribution (OOD) datasets, D1ct and D2ct, which contain unseen cell types. The results are shown for various methods, including non-TFM methods and different TFMs (ontology-agnostic and ontology-enhanced). The metrics used to evaluate the performance include Normalized Mutual Information (NMI), Adjusted Rand Index (ARI), Average Silhouette Width (ASW), and the average of these three scores (AvgBio). The table allows for a detailed comparison of the performance of different methods in handling unseen cell types in a zero-shot setting.

This table presents the complete results of the cell type clustering experiment on out-of-distribution (OOD) datasets focusing on unseen tissue types. It provides a comprehensive evaluation by comparing various methods across multiple metrics, including Normalized Mutual Information (NMI), Adjusted Rand Index (ARI), Average Silhouette Width (ASW), and the combined score AvgBio. This detailed breakdown allows for a thorough analysis of each method’s performance under unseen tissue conditions.

This table presents the results of cell type clustering experiments conducted on out-of-distribution (OOD) datasets focusing on unseen donors. The table shows the performance of various methods, including non-TFM methods, ontology-agnostic TFMs, and ontology-enhanced TFMs, across several evaluation metrics (NMI, ARI, ASW, AvgBio). The results highlight the performance of scCello compared to the other approaches in handling the challenge of unseen donor data. Note that the scTab method ran out of memory (OOM) on these specific datasets.

This table presents the results of zero-shot cell type clustering experiments conducted on both in-distribution (ID) and out-of-distribution (OOD) datasets. The experiments compared the performance of scCello against several other methods, including both traditional non-TFM methods (like Raw Data, Seurat, Harmony, and scVI) and other ontology-agnostic TFMs (Geneformer, scGPT, scTab, and UCE). The performance of scCello is compared with three ablated versions of scCello, and the results are evaluated using several metrics including NMI, ARI, ASW, and AvgBio to assess the quality of clustering across different datasets. The OOD datasets are categorized into three scenarios: unseen cell types, unseen cell tissues, and unseen donors, to test the model’s generalization ability under diverse conditions.
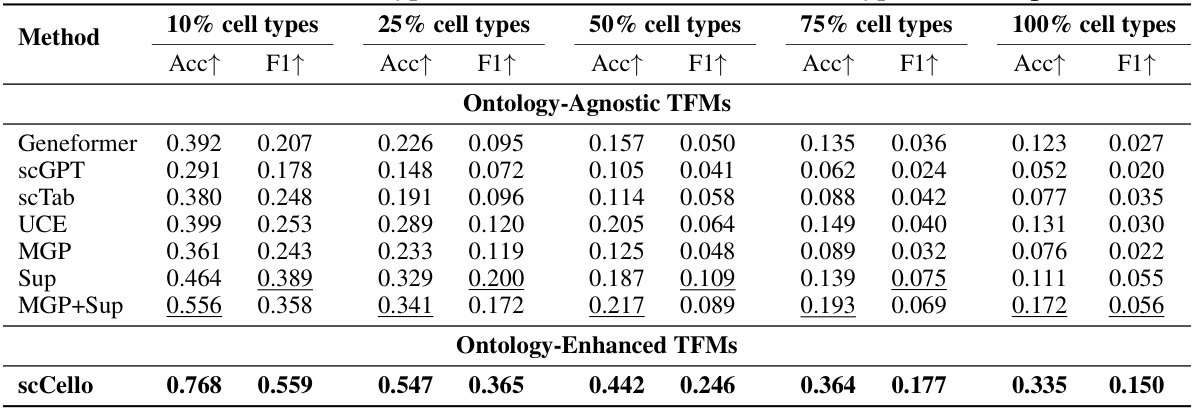
This table presents the results of novel cell type classification on the out-of-distribution (OOD) cell type dataset Dit. It shows the accuracy (Acc) and F1 scores achieved by different methods (Ontology-Agnostic TFMs and Ontology-Enhanced TFMs) for varying proportions of novel cell types (10%, 25%, 50%, 75%, and 100%). The results are useful to evaluate the performance of different methods and the generalizability to unseen cell types.
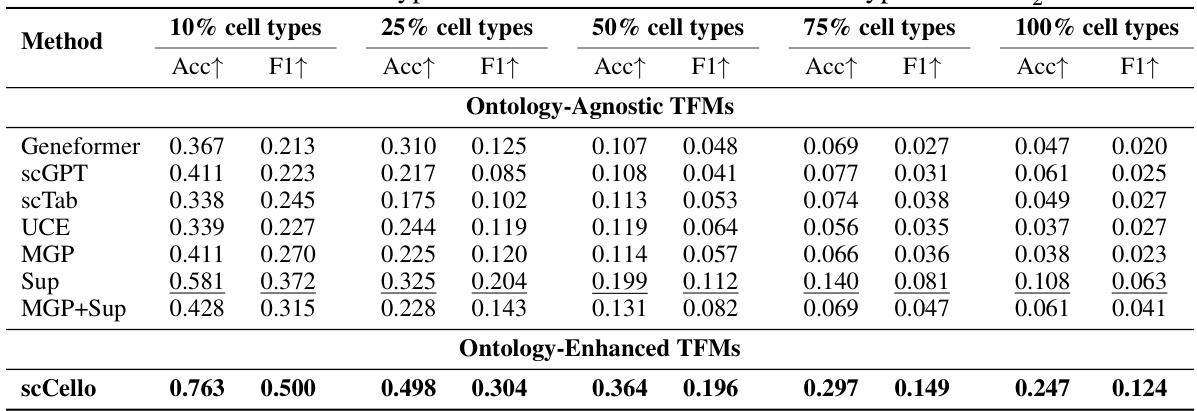
This table presents the results of novel cell type classification experiments conducted on the Dit dataset. The results are broken down by the percentage of novel cell types included (10%, 25%, 50%, 75%, and 100%), and performance is measured using Accuracy (Acc) and F1-score (F1). The table compares the performance of various TFMs (Transcriptome Foundation Models), including both ontology-agnostic and ontology-enhanced models. The ontology-enhanced models incorporate cell ontology information during training, leading to improvements in classification accuracy compared to their ontology-agnostic counterparts.
This table presents the results of zero-shot cell type clustering on both in-distribution (ID) and out-of-distribution (OOD) datasets. It compares the performance of scCello against several other methods (both TFM and non-TFM methods), across multiple metrics (NMI, ARI, ASW, AvgBio) for six different OOD datasets categorized by unseen cell types, tissues, and donors. The goal is to evaluate the generalization capabilities of scCello and demonstrate its superior performance compared to other approaches.
This table presents the results of zero-shot cell type clustering experiments conducted on both in-distribution (ID) and out-of-distribution (OOD) datasets. The results are compared across various methods including several transcriptome foundation models (TFMs) as well as several non-TFM baselines, showcasing the performance of scCello against existing state-of-the-art approaches. The OOD datasets are further broken down into three scenarios: unseen cell types, unseen cell tissues, and unseen donors, each with two corresponding datasets, adding further complexity and showing the generalization abilities of the models tested.

This table shows the number of cells present in each of the six subsets of the GSE96583 dataset and one subset from the GSE130148 dataset. These datasets were used in the marker gene prediction experiments described in Section 4.4 of the paper.
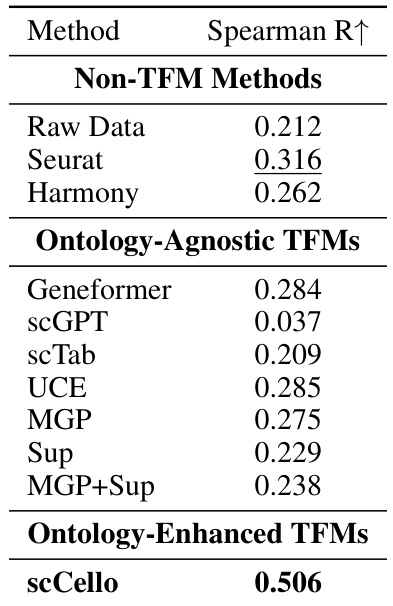
This table presents the Spearman’s rank correlation between the structural similarity of cell types derived from the cell ontology graph and the pairwise similarity of cell type representations generated by various TFMs (including scCello and its ablations). Higher Spearman’s rank correlation indicates a stronger agreement between the cell ontology structure and the learned cell type representations, suggesting better performance in capturing biological relationships.
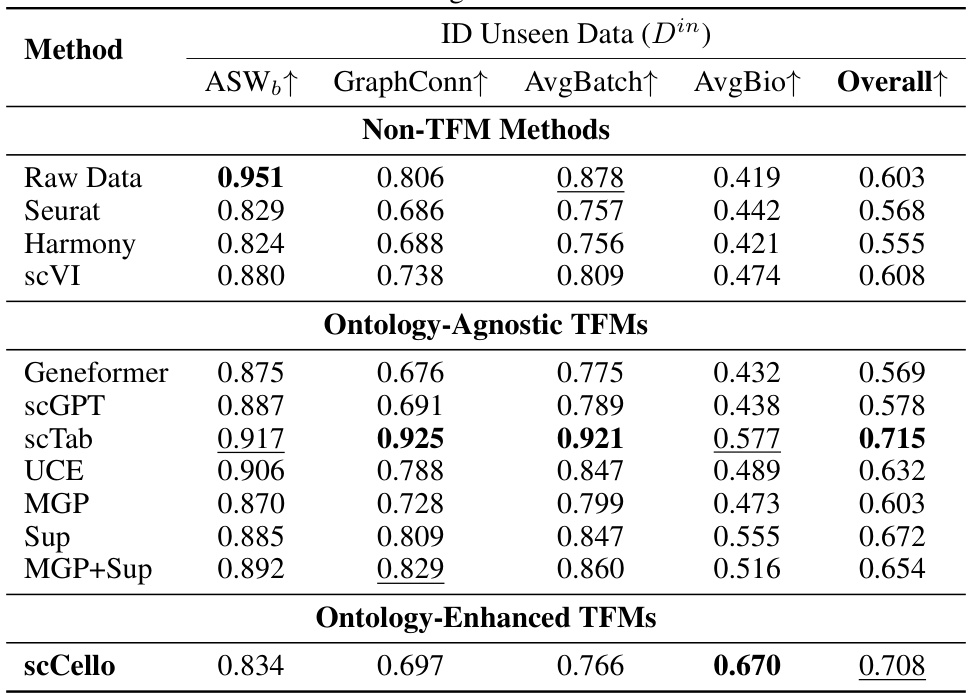
This table presents the results of batch integration experiments on the in-distribution (ID) dataset Did. The performance of scCello and various baseline methods (including non-TFM methods and other TFMs) is evaluated using several metrics: ASW (Average Silhouette Width), GraphConn (Graph Connectivity), AvgBatch (a combined metric of ASW and GraphConn), AvgBio (average of NMI, ARI, and ASW), and Overall (a weighted average of AvgBio and AvgBatch). Higher scores generally indicate better performance.

This table presents the results of zero-shot cell type clustering experiments conducted on both in-distribution (ID) and out-of-distribution (OOD) datasets. The experiments compare various methods, including non-TFM methods (like raw data, Seurat, Harmony, scVI) and ontology-agnostic TFMs (Geneformer, scGPT, scTab, UCE, and ablations of scCello), against the ontology-enhanced TFM, scCello. The performance is evaluated using four metrics: Normalized Mutual Information (NMI), Adjusted Rand Index (ARI), Average Silhouette Width (ASW), and the average of these three (AvgBio). The results are presented for the ID dataset (Did) and six OOD datasets, grouped into three scenarios: unseen cell types (Dct1 and Dct2), unseen tissues (Dts1 and Dts2), and unseen donors (Ddn1 and Ddn2). This allows for an assessment of the generalization capabilities and robustness of each method across different data conditions. The ‘OOD Avg.’ column represents the average AvgBio across the six OOD datasets.
This table presents a comprehensive evaluation of various methods, including both non-TFM and TFM approaches, in performing zero-shot cell type clustering on two out-of-distribution (OOD) datasets, Dit and Dot, which contain unseen cell types. The metrics used for evaluation are Normalized Mutual Information (NMI), Adjusted Rand Index (ARI), Average Silhouette Width (ASW), and the average of these three scores (AvgBio). The results reveal how well different methods generalize to previously unseen cell types, highlighting the effectiveness of different approaches.

This table presents the results of zero-shot cell type clustering experiments conducted on both in-distribution (ID) and out-of-distribution (OOD) datasets. The ID dataset serves as a baseline for comparison. The OOD datasets represent various scenarios, such as unseen cell types, unseen tissues, and unseen donors, to evaluate the generalization ability of different methods. The table lists several methods (non-TFM and TFM methods, including the proposed scCello) and shows their performance using metrics such as NMI, ARI, ASW, and AvgBio for each dataset. Higher values in each metric generally indicate better performance.
Full paper#


