↗ OpenReview ↗ NeurIPS Proc. ↗ Chat
TL;DR#
Analyzing large-scale brain activity data from fMRI is crucial for understanding cognitive processes, but existing deep learning models struggle with limited generalizability and high noise levels in fMRI signals. Previous models like BrainLM, while innovative, had limitations such as suboptimal performance in off-the-shelf evaluations and restricted applicability across various ethnic groups. These limitations hinder the potential of AI-driven neuroscience research.
Brain-JEPA introduces two key innovations to overcome these challenges: Brain Gradient Positioning, a functional coordinate system to improve the positional encoding of brain regions, and Spatiotemporal Masking, a novel masking strategy to address the heterogeneous nature of fMRI data. Through these techniques, Brain-JEPA achieves state-of-the-art performance in demographic prediction, disease diagnosis/prognosis, and trait prediction, showing significant improvements over existing models and superior generalizability across different ethnic groups.
Key Takeaways#
Why does it matter?#
This paper is crucial for researchers in AI and neuroscience due to its introduction of Brain-JEPA, a novel foundation model for brain activity analysis. It addresses critical limitations of existing fMRI analysis methods by introducing innovative techniques like Brain Gradient Positioning and Spatiotemporal Masking. This work opens up new avenues for large-scale fMRI analysis and paves the way for improved disease diagnosis and understanding of brain dynamics, thereby impacting future AI-driven neuroscience research.
Visual Insights#

Brain-JEPA uses a Vision Transformer as its encoder. The input fMRI data is divided into patches, and spatiotemporal masking divides the data into three regions (cross-ROI, cross-time, double-cross). A smaller ViT predictor network uses the observation block to predict the representations of target blocks from these regions. The target encoder’s parameters are updated using an exponential moving average of the observation encoder’s parameters.

This table presents the results of age and sex prediction on a held-out 20% of the UK Biobank dataset. It compares several different methods, including BrainNetCNN, BrainGNN, BNT, TFS, and BrainLM, against the proposed Brain-JEPA model. The metrics used for comparison are Mean Squared Error (MSE), Pearson Correlation (ρ), Accuracy (ACC), and F1 score. The best performance is highlighted in bold, and statistically significant improvements over previous methods are marked with an asterisk.
In-depth insights#
Brain Dynamics Model#
A brain dynamics model, in the context of this research paper, likely refers to a computational model designed to simulate and analyze the complex temporal patterns of brain activity. Such a model would aim to capture the dynamic interactions between different brain regions, going beyond static representations of brain structure. Key aspects of a successful brain dynamics model would involve the incorporation of temporal dependencies and the ability to predict future brain states from past activity. The model’s architecture and algorithms would need to effectively handle the high dimensionality and noise inherent in brain imaging data such as fMRI. The integration of advanced techniques, such as those described in the paper (like gradient positioning and spatiotemporal masking), is critical for enhancing the model’s accuracy and generalizability. Ultimately, a robust brain dynamics model serves as a valuable tool for advancing our understanding of the neural mechanisms underlying cognition, behavior, and various neurological conditions. Success is measured by the model’s ability to accurately predict brain activity patterns across diverse populations and tasks.
Gradient Positioning#
The concept of ‘Gradient Positioning’ in the context of brain imaging analysis is a novel approach to encode spatial information within a neural network. Instead of relying on simple anatomical locations, which may not accurately reflect functional connectivity, this method leverages the functional connectivity gradient. This gradient represents a continuous measure capturing functional relationships among brain regions. By embedding this gradient, the model learns a representation that directly reflects the functional organization of the brain, rather than just its physical structure. This is particularly beneficial for fMRI data, which is characterized by heterogeneous and spatially varying BOLD signals. By using functional connectivity gradients as a coordinate system, the model is better able to learn complex spatiotemporal patterns, leading to improved performance on downstream tasks such as disease prediction and trait analysis. The innovative aspect lies in using a functional coordinate system derived from diffusion mapping of the brain’s connectivity matrix, thus creating a richer and more informative positional encoding than traditional methods. This approach significantly improves the model’s ability to generalize across different populations and tasks, demonstrating a key advantage in addressing some of the current limitations of fMRI analysis in AI.
Spatiotemporal Masking#
Spatiotemporal masking, as presented in the context of brain dynamics modeling, is a crucial technique for effectively handling the unique characteristics of fMRI data. The inherent heterogeneity and sparsity of fMRI time-series data pose significant challenges for traditional deep learning approaches. Standard masking techniques, often employed successfully with image data, fail to capture the complex interplay between spatial and temporal correlations in brain activity. The proposed spatiotemporal masking method directly addresses this by dividing fMRI data into carefully selected regions, aiming to create a more robust and informative learning signal. The method emphasizes learning the relationships between spatially distinct regions (Cross-ROI), temporally separated time points (Cross-Time), and combinations of both (Double-Cross). This structured approach forces the model to learn more generalized representations rather than relying on simple interpolations or easily learned patterns. By intelligently masking the data according to these spatial and temporal relationships, spatiotemporal masking contributes significantly to improved downstream prediction performance and a deeper understanding of complex brain dynamics.
Downstream Tasks#
The ‘Downstream Tasks’ section of a research paper would detail the applications of a newly developed model or technique. It’s crucial to assess the diversity and relevance of these tasks, considering their alignment with the model’s core capabilities and potential real-world impact. A strong ‘Downstream Tasks’ section would showcase the model’s generalizability and adaptability, demonstrating its effectiveness across a range of challenging problems. Quantitative results, such as precision, recall, F1-score, and AUC, should be presented alongside qualitative analyses that provide deeper insights into the model’s behavior and performance. Furthermore, comparing results to existing state-of-the-art methods is essential for demonstrating the model’s novelty and improvement. Finally, the discussion should acknowledge any limitations encountered during the downstream tasks and suggest potential avenues for future research, highlighting the broader implications and potential societal impact of the proposed model.
Future Research#
The paper’s ‘Future Research’ section would ideally delve into several crucial areas. Larger model exploration is paramount; the current results suggest that scaling up the model architecture (e.g., to ViT-H) could yield further improvements. Data diversity is another key area, emphasizing the need for a more inclusive dataset representing diverse ethnicities and acquisition parameters to enhance generalizability and robustness. Fine-grained interpretability is critical; developing methods to better pinpoint relevant brain regions and timepoints within the model’s predictions could unlock deeper understanding of the underlying neural mechanisms. Finally, the authors correctly point to the potential of multi-modal integration by combining fMRI data with other modalities like EEG or MEG to obtain a richer representation of brain activity. These future directions hold great promise in pushing the boundaries of brain dynamics modeling and its clinical applications.
More visual insights#
More on figures

This figure shows how Brain Gradient Positioning works. Panel (A) displays the brain surface, where different cortical regions are colored according to their positions in a three-dimensional gradient space. Panel (B) shows the three-dimensional gradient space itself, with each point representing a brain region and its position defined by three gradient axes. The color coding in (A) and (B) is consistent, illustrating the mapping between the brain’s functional organization and the gradient space representation. The gradient axes are derived from the functional connectivity between brain regions, capturing their relationships and forming a functional coordinate system for brain activity analysis.

This figure shows the performance of Brain-JEPA with different model sizes (ViT-S, ViT-B, and ViT-L) on three downstream tasks: age prediction, sex prediction, and NC/MCI classification. The results demonstrate that larger model configurations consistently achieve better performance. The x-axis represents the model size, and the y-axis represents the performance metric (Pearson correlation for age prediction and accuracy for sex prediction and NC/MCI classification).

The figure shows the performance of Brain-JEPA with different model sizes (ViT-S, ViT-B, and ViT-L) across three downstream tasks: age prediction, sex prediction, and amyloid classification. It demonstrates that larger models generally achieve better performance, indicating a positive scaling property with model size. The x-axis represents the model size while the y-axis represents the performance metrics. Specific metrics shown are Pearson correlation for age prediction, accuracy for sex prediction, and accuracy for amyloid classification.

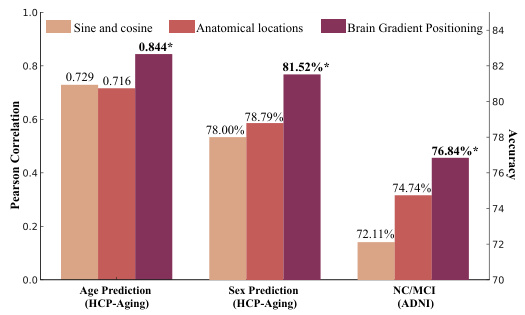
This figure compares three different methods for spatial positional embedding in the Brain-JEPA model: sine and cosine functions, anatomical locations, and brain gradient positioning. The results show that brain gradient positioning achieves significantly better performance across three downstream tasks: age prediction, sex prediction, and NC/MCI classification. This highlights the effectiveness of brain gradient positioning in capturing functional relationships between brain regions.

This figure shows the performance of Brain-JEPA across various model sizes (ViT-S, ViT-B, and ViT-L). The results demonstrate that larger model configurations consistently achieve better performance, with a clear trend of increasing accuracy/correlation with larger models. The largest model (ViT-L) consistently achieves the best performance across age prediction, sex prediction, and NC/MCI classification tasks.

This figure displays the attention weights across seven different brain networks (CN, DMN, DAN, LN, SAN, SMN, VN) for NC/MCI classification in both Caucasian and Asian populations. The bar graphs show the average attention weights for each network in each group, while the brain image displays the spatial distribution of attention weights across the ROIs, color-coded according to the network they belong to. The results highlight the consistent patterns across different ethnic groups, emphasizing the critical roles of several networks (DMN, CN, SAN, and LN) in cognitive impairment.
More on tables

This table presents the results of applying Brain-JEPA and several other methods to predict age, sex, neuroticism, and flanker scores on the HCP-Aging dataset. It shows the mean squared error (MSE) for age prediction and neuroticism, the Pearson correlation (ρ) for the same two tasks and accuracy (ACC) and F1 score for sex prediction. Brain-JEPA achieves superior performance compared to previous state-of-the-art methods.

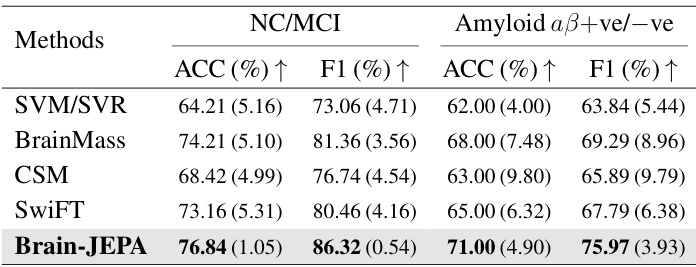
This table presents the results of Brain-JEPA and other methods on external tasks of brain disease diagnosis and prognosis using two datasets: ADNI and MACC. The results show the performance of each method in terms of accuracy (ACC) and F1 score for classifying normal control (NC) versus mild cognitive impairment (MCI), and amyloid positive versus negative in both Caucasian (ADNI) and Asian (MACC) cohorts. The table demonstrates Brain-JEPA’s performance compared to other state-of-the-art methods.

This table shows the hyperparameters used for pre-training the Brain-JEPA model. It details the optimizer used (AdamW), its momentum parameters, the learning rate schedule (warmup cosine), the starting, final and overall learning rates, weight decay schedule and parameters, the EMA (Exponential Moving Average) momentum schedule and its start and final values, the total batch size (across multiple GPUs), the number of warmup epochs, patch size, dimension of the gradient vector, and the total number of training epochs.

This table presents the hyperparameters used for both end-to-end fine-tuning and linear probing. It shows the optimizer used (AdamW for fine-tuning and LARS for linear probing), optimizer momentum, learning rate schedule, base learning rate, weight decay (only applied to fine-tuning), layer-wise learning rate decay (only applied to fine-tuning), batch size, warmup epochs, and the number of training epochs. The values differ between the two training methods reflecting differences in optimization strategies.

This table presents the hyperparameters used for the spatiotemporal masking strategy in Brain-JEPA. It specifies the mask ratios for different regions of the input fMRI data: the observation block and three target regions (Cross-ROI (α), Cross-Time (β), and Double-Cross (γ)). The mask ratios are defined as ranges (ηR, ηT) for the ROI and timestep dimensions, respectively. These ranges control the amount of data masked in each region during pre-training, forcing the model to learn more robust and generalizable representations.

This table presents the performance comparison of Brain-JEPA against other baselines on the HCP-aging dataset for age and sex prediction tasks. The metrics used for comparison include Mean Squared Error (MSE), Pearson Correlation (ρ), Accuracy (ACC), and F1 score. Lower MSE indicates better performance for age prediction, while higher ρ, ACC, and F1 scores indicate better performance for both age and sex prediction. The results show that Brain-JEPA significantly outperforms other methods.

This table presents the performance comparison of Brain-JEPA against several baseline models on the ADNI dataset for two tasks: NC/MCI classification and amyloid-positive/negative classification. The metrics used are accuracy (ACC) and F1 score, reflecting the model’s ability to correctly classify samples. The results show Brain-JEPA’s superior performance compared to other methods.

This table compares the performance of Brain-JEPA against other baselines (SVM/SVR, BrainMass, CSM, SwiFT) on the HCP-Aging dataset for age and sex prediction tasks. It shows the Mean Squared Error (MSE), Pearson Correlation (p), Accuracy (ACC), and F1 score for each model, highlighting Brain-JEPA’s superior performance across all metrics.

This table shows the ablation study results on different dataset sizes used for pretraining the model. The results for age prediction (Pearson correlation), sex prediction (accuracy), and NC/MCI classification (accuracy) are presented for dataset sizes of 25%, 50%, 75%, and 100% of the total dataset. The table demonstrates how increasing the size of the pretraining dataset improves the model’s performance on downstream tasks.

This table presents the results of age and sex prediction on a held-out portion of the UK Biobank dataset. It compares Brain-JEPA’s performance against several other methods (BrainNetCNN, BrainGNN, BNT, and BrainLM) using metrics such as MSE (lower is better), Pearson Correlation (higher is better), Accuracy, and F1 score (higher is better). The best performance is highlighted in bold, and statistically significant improvements (p<0.05) are indicated with an asterisk.

This table presents the results of the internal tasks (age and sex prediction) performed on the held-out 20% of the UK Biobank (UKB) dataset. The performance metrics reported are Mean Squared Error (MSE), Pearson Correlation (ρ), Accuracy (ACC), and F1 score. The results are averaged over 5 independent runs, with standard deviations shown. Statistically significant improvements (p<0.05) over prior approaches are marked with an asterisk (*).

This table compares the performance of Brain-JEPA using 3-dimensional and 30-dimensional brain gradient positioning for age prediction on HCP-Aging, sex prediction on HCP-Aging and Amyloid +ve/-ve classification on ADNI. The results show that using 30-dimensional brain gradient positioning significantly improves the performance in all three tasks.
Full paper#


