↗ OpenReview ↗ NeurIPS Proc. ↗ Chat
TL;DR#
Self-supervised learning, a crucial area in computer vision, has seen advancements with the Joint-Embedding Predictive Architecture (JEPA). However, JEPA faces limitations: its Exponential Moving Average (EMA) struggles to prevent model collapse, and its prediction mechanism isn’t accurate in learning patch representation means. These issues hinder performance and broader applicability.
This paper introduces C-JEPA, a novel framework that addresses these limitations. C-JEPA integrates JEPA with the Variance-Invariance-Covariance Regularization (VICReg) strategy to effectively learn variance/covariance, preventing collapse and ensuring mean invariance across augmented views. Empirical and theoretical analyses show that C-JEPA significantly improves the stability and quality of visual representation learning, demonstrating rapid and improved convergence in various downstream tasks.
Key Takeaways#
Why does it matter?#
This paper is important because it addresses critical limitations of existing self-supervised learning methods. By enhancing stability and improving accuracy, C-JEPA offers a significant advancement in unsupervised visual representation learning. This work opens avenues for research on more robust and efficient self-supervised models, impacting various computer vision tasks and potentially improving the performance of downstream applications.
Visual Insights#
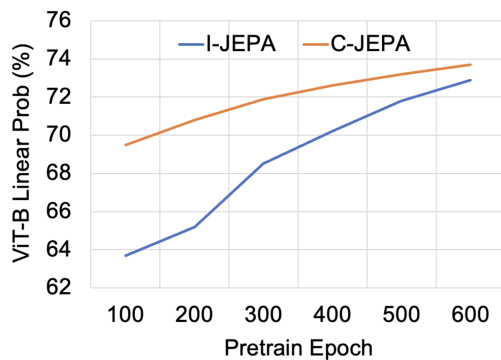
This figure shows a comparison of the convergence speed and performance of the proposed C-JEPA model against the baseline I-JEPA model. The y-axis represents the linear probing performance (percentage) achieved on a ViT-B model, and the x-axis represents the number of pre-training epochs. The line graph clearly demonstrates that C-JEPA surpasses I-JEPA in both convergence rate (reaching higher performance with fewer epochs) and final performance (achieving a higher percentage). This indicates that the improvements introduced by C-JEPA, such as the integration of VICReg, significantly enhance the stability and quality of visual representation learning.

This table compares the performance of C-JEPA with other state-of-the-art self-supervised learning methods on various downstream tasks, including image classification, object detection, instance segmentation, and semantic segmentation. The results are presented for the ViT-B/16 model architecture, with metrics such as linear probing accuracy, fine-tuning accuracy, average precision for bounding boxes (APbox), average precision for masks (Apmask), and mean Intersection over Union (mIoU) used to evaluate performance.
In-depth insights#
JEPA Limitations#
The Joint Embedding Predictive Architecture (JEPA) shows promise in self-supervised visual representation learning, but faces key limitations. Inadequate Exponential Moving Average (EMA) in I-JEPA often leads to model collapse, hindering performance. Inaccurate mean learning of patch representations by I-JEPA’s predictor is another significant weakness, preventing robust feature extraction. These limitations restrict JEPA’s broader applicability and highlight the need for improved prediction mechanisms and EMA strategies. Addressing these issues is crucial for unlocking JEPA’s full potential and enhancing the stability and quality of self-supervised visual representation learning.
C-JEPA Framework#
The C-JEPA framework represents a novel approach to self-supervised visual representation learning, combining the strengths of the Joint-Embedding Predictive Architecture (JEPA) with the Variance-Invariance-Covariance Regularization (VICReg) strategy. This integration directly addresses JEPA’s limitations, namely the inadequacy of its Exponential Moving Average (EMA) in preventing model collapse and its insufficient accuracy in learning the mean of patch representations. By incorporating VICReg, C-JEPA effectively learns both the variance and covariance of representations, thus preventing complete model collapse and ensuring invariance in the mean of augmented views. This leads to improved stability and quality of learned representations. Empirical results demonstrate that C-JEPA achieves faster convergence and superior performance compared to I-JEPA, particularly when pre-trained on large-scale datasets like ImageNet-1K. The framework’s integration of contrastive learning principles with a joint-embedding architecture offers a promising avenue for advancing the state-of-the-art in self-supervised learning, showing potential for broader applicability across diverse visual understanding tasks. The efficacy of C-JEPA highlights the value of combining predictive and contrastive learning paradigms for robust and efficient visual representation learning.
VICReg Integration#
Integrating VICReg into a self-supervised learning framework like JEPA offers a compelling approach to address inherent limitations. VICReg’s strength lies in its regularization techniques, focusing on variance, invariance, and covariance to prevent model collapse and encourage the learning of more meaningful representations. By incorporating VICReg, the resulting C-JEPA framework aims to improve the stability and quality of learned features. This is particularly crucial in preventing the entire collapse issue sometimes observed in I-JEPA and ensuring more accurate learning of the mean of patch representations. The combination of JEPA’s predictive masking and VICReg’s regularization is expected to yield a more robust and effective self-supervised learning system. Empirical evaluations are vital to demonstrate whether this integration leads to improved performance metrics on downstream tasks and faster convergence during pre-training, thus confirming the theoretical benefits of this approach. Careful consideration of hyperparameter tuning will be critical, especially in balancing the original JEPA loss with the VICReg regularization terms, to achieve optimal performance. The success of this integration hinges on the effectiveness of combining the distinct strengths of both frameworks in a synergistic manner.
Empirical Validation#
An Empirical Validation section in a research paper would rigorously test the claims made in the paper. This would involve a multifaceted approach. First, it would define clear metrics to measure the performance of the proposed method, ensuring that they directly address the central hypotheses. Then, it would meticulously describe the experimental setup, including datasets used, evaluation protocols, and any pre-processing steps, allowing for reproducibility. The results would be presented clearly, often with visualization tools like graphs and tables, to highlight significant findings and statistical significance. A robust empirical validation goes beyond simply demonstrating improved performance; it would include an ablation study to isolate the contributions of individual components, comparisons with state-of-the-art baselines, and analysis of failure cases to assess the limitations of the method. Robust statistical analysis is crucial to support the claims and ensure that observed improvements aren’t due to chance. Detailed error analysis and exploration of various parameter settings would further strengthen the validation. Finally, the discussion section should critically evaluate the results, acknowledging limitations and suggesting avenues for future work. A strong emphasis on transparency and reproducibility is essential to ensure the validation’s credibility and impact within the research community.
Future Directions#
Future research could explore several promising avenues. Extending C-JEPA’s effectiveness to video data would be a significant step, potentially leveraging temporal context for improved representation learning. Investigating the impact of different augmentation strategies on C-JEPA’s performance is crucial; optimizing augmentations for various datasets and downstream tasks could unlock further gains. The theoretical analysis of C-JEPA’s convergence properties could be strengthened; a deeper theoretical understanding would guide further architectural improvements. Finally, exploring the scalability of C-JEPA to larger datasets and more complex visual tasks is essential for demonstrating its real-world applicability. Research into the generalizability across diverse modalities, such as audio or text, alongside image data, could also broaden its impact and create a more comprehensive self-supervised learning framework.
More visual insights#
More on figures

This figure illustrates the architectures of I-JEPA and SimSiam, two self-supervised learning methods. Panel (a) shows I-JEPA, which uses a masking strategy to predict masked patches of an image. A context encoder processes the entire image, and a target encoder processes the masked patches. The predictor aims to reconstruct the masked patches based on the context encoder’s output. Panel (b) shows SimSiam, which uses two differently augmented views of the same image. These views are processed by the encoder, and a predictor network is used to create a similarity between the two outputs. Both methods aim to learn robust image representations in an unsupervised manner, but they use different strategies for achieving this.

This figure presents a qualitative comparison of attention maps generated by the I-JEPA and C-JEPA models on a set of images. Each image is accompanied by three attention maps: one from I-JEPA’s target encoder, one from C-JEPA’s target encoder, and one from C-JEPA’s context encoder. The figure visually demonstrates that C-JEPA produces more focused and contextually relevant attention maps than I-JEPA, highlighting its improved ability to capture important features and relationships within images.

This figure compares attention maps from the I-JEPA and C-JEPA models for several images. It shows attention maps from both the target and context encoders for each model. The caption states that the C-JEPA model produces better attention maps. This visualization supports the claim that C-JEPA improves the quality and stability of visual representation learning.

This figure shows a qualitative comparison of attention maps generated by the I-JEPA and C-JEPA models on the ViT-B/16 architecture. For each image, it displays the original image along with three attention maps: one from the target encoder of the original I-JEPA, one from the target encoder of the improved C-JEPA, and one from the context encoder of the C-JEPA. The comparison highlights the improved quality and focus of attention maps produced by the C-JEPA model, indicating its ability to identify and focus on relevant features more effectively. The improved attention maps from C-JEPA suggest a superior understanding of the image context and are consistent with the quantitative performance improvements reported in the paper.

This figure displays a qualitative comparison of attention maps generated by the original I-JEPA and the improved C-JEPA models. For each image, three sets of attention maps are shown: I-JEPA’s target encoder, C-JEPA’s target encoder, and C-JEPA’s context encoder. The visualization demonstrates that C-JEPA produces more focused and contextually relevant attention maps compared to I-JEPA, highlighting the efficacy of the proposed modifications. The improved attention maps suggest that C-JEPA learns more meaningful and informative representations from the image data.

This figure shows a qualitative comparison of attention maps generated by I-JEPA and C-JEPA models. Each row represents a different image, and the columns show the original image along with attention maps from the target and context encoders of both I-JEPA and C-JEPA. The C-JEPA attention maps are more focused and contextually relevant compared to I-JEPA. This demonstrates that C-JEPA learns more focused and meaningful representations.
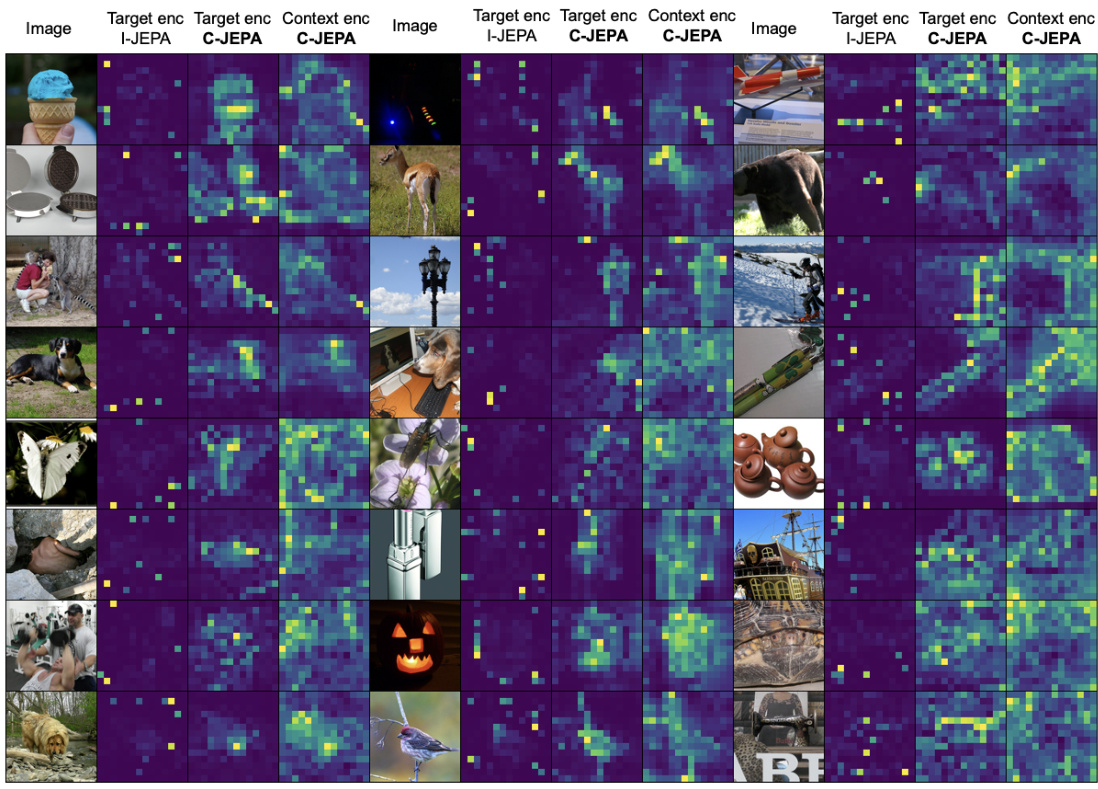
This figure displays a qualitative comparison of attention maps generated by the I-JEPA and C-JEPA models. For each image, three columns show the original image, attention maps from the target encoder of the I-JEPA model, attention maps from the target encoder of the C-JEPA model, and finally, attention maps from the context encoder of the C-JEPA model. The visualization demonstrates that C-JEPA produces more focused and contextually relevant attention maps than I-JEPA, highlighting the improvement in feature extraction and contextual understanding.
More on tables

This table presents the results of experiments conducted using larger ViT-L/16 models. It shows performance metrics for linear probing, fine-tuning, video object segmentation, and low-level tasks (Clevr/Count and Clevr/Dist). The metrics are used to evaluate the quality of the visual representations learned by the model. The best performance for each metric is shown in bold.

This table presents the ablation study results on the effects of Variance/Covariance and Invariance modules from VICReg on the C-JEPA model’s performance. It shows the linear probing, fine-tuning, and J&F metrics (for video object segmentation) for different configurations of these modules, highlighting the impact of each component on the overall performance. The best results for each metric are bolded.

This table presents the results of ablation studies conducted to analyze the impact of different components of the VICReg regularization strategy on the convergence and performance of the C-JEPA model. It shows the effects of including or excluding Variance/Covariance and Invariance terms, with and without using EMA for collapse, on various metrics like linear probing, fine-tuning, and (J&F)_m. The use of all three terms (Variance, Covariance, and Invariance) yields the best results, suggesting their combined importance for optimal performance.

This table presents the results of image classification experiments on the ImageNet-1K dataset using pre-trained Vision Transformer models (ViT-T/16 and ViT-S/16). The performance is evaluated using three different approaches: k-nearest neighbors (knn), linear probing (linprob), and fine-tuning. The table shows the top-1 accuracy for each model and approach, highlighting the best performance for each setting.
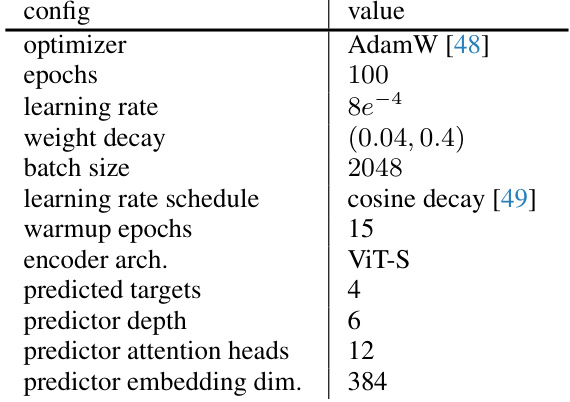
This table details the hyperparameters used for pre-training the Vision Transformer Small (ViT-S) model. It specifies the optimizer, number of training epochs, learning rate, weight decay, batch size, learning rate scheduling, warmup epochs, encoder architecture, number of predicted targets, predictor depth, number of predictor attention heads, and predictor embedding dimension.

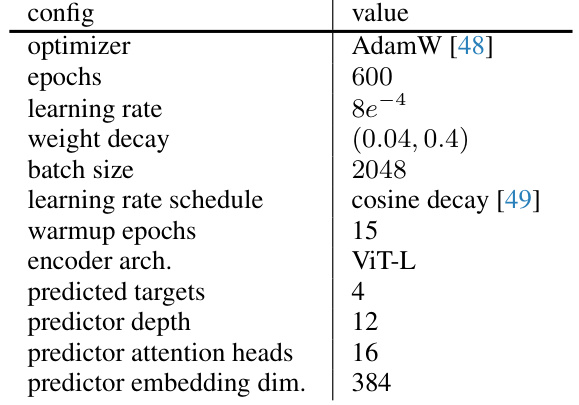
This table details the hyperparameters used during the pretraining phase for the ViT-B model. It lists the optimizer used (AdamW), the number of training epochs, learning rate, weight decay, batch size, the learning rate schedule (cosine decay), the number of warmup epochs, the encoder architecture (ViT-B), the number of predicted targets, the predictor depth, the number of predictor attention heads, and the predictor embedding dimension. These settings were crucial in achieving optimal performance for the model.
This table compares the performance of the proposed C-JEPA model with several prior state-of-the-art self-supervised learning methods. The comparison is done using a ViT-B/16 model pre-trained on ImageNet-1K, and the evaluation is performed across multiple downstream tasks: linear evaluation (linprob), fine-tuning (fine-tune), COCO object detection (Apbox, Apmask), and ADE20K semantic segmentation (mIoU). The best performance for each metric is highlighted in bold.

This table shows the results of image classification experiments on the ImageNet-1K dataset using pre-trained ViT-T/16 and ViT-S/16 models. The models were evaluated using three methods: k-nearest neighbors (knn), linear probing (linprob), and fine-tuning. The top-1 accuracy is reported for each method, providing a comparison of the quality of representations learned by the different training methods. The best results for each model and method are highlighted in bold.

This table presents the results of fine-tuning pre-trained Vision Transformer models (ViT-T/16 and ViT-S/16) on the MS COCO dataset for object detection and instance segmentation tasks. The performance is measured using Average Precision (AP) for bounding boxes (Apbox) and Average Precision for instance masks (Apmask) at different Intersection over Union (IoU) thresholds (50 and 75). The table highlights the superior performance of C-JEPA compared to the baseline I-JEPA.

This table presents the results of ADE20K semantic segmentation using fine-tuned ViT-T/16 and ViT-S/16 models. The models were pre-trained using the proposed C-JEPA and the baseline I-JEPA methods. The performance is evaluated using three metrics: mean Intersection over Union (mIoU), average accuracy (aAcc), and mean accuracy (mAcc). The best results for each metric and model are highlighted in bold, demonstrating the superior performance of C-JEPA.

This table presents the ablation study results on the impact of Variance/Covariance and Invariance modules of VICReg on the performance of the C-JEPA model using ViT-T/16 architecture. It shows the effect of including or excluding these components (indicated by checkmarks and crosses) on the knn, linprob, and fine-tune metrics. The best performing configuration for each metric is highlighted in bold.

This table presents the ablation study results on the impact of Variance/Covariance and Invariance modules of VICReg on the convergence speed of the ViT-T/16 model. It compares different combinations of these modules (including no VICReg) against the baseline I-JEPA method, evaluating their performance using knn, linprob, and fine-tune metrics. The best-performing configuration for each metric is highlighted in bold.
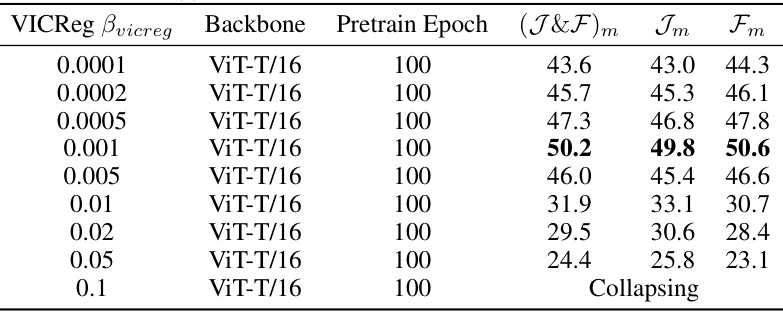
This table presents the results of ablation studies performed to analyze the impact of different VICReg coefficient values on the performance of the C-JEPA model. The study varies the VICReg coefficient (βvicreg) while keeping other hyperparameters consistent and measures the performance using three metrics: (J&F)m,Jm,Fm on ViT-T/16 model. The best performance is highlighted in bold.

This table presents the ablation study results on the impact of different invariance coefficients used in the VICReg component of the C-JEPA model. The study varies the invariance coefficient (βsim) while keeping other parameters consistent and reports the performance metrics (knn, linprob, fine-tune) for ViT-T/16 model. The best results among different coefficient values are highlighted in bold.
Full paper#


