↗ OpenReview ↗ NeurIPS Proc. ↗ Chat
TL;DR#
Estimating local intrinsic dimension (LID), a measure of data complexity, is crucial yet challenging. Existing methods are computationally expensive or inaccurate, particularly for high-dimensional data. This often limits their use in complex AI applications that deal with large datasets, such as image analysis.
This paper introduces FLIPD, a novel LID estimator that leverages diffusion models. Unlike previous approaches, FLIPD uses a single pre-trained diffusion model and the Fokker-Planck equation to efficiently estimate LID. The results demonstrate FLIPD’s superior accuracy and speed, particularly with high-dimensional image data, outperforming existing baselines. The differentiability of FLIPD also offers exciting possibilities for future research by integrating it into larger workflows.
Key Takeaways#
Why does it matter?#
This paper is important because it presents FLIPD, a novel and efficient method for estimating local intrinsic dimension (LID) using diffusion models. This addresses a critical challenge in understanding data complexity and has implications for various AI tasks such as out-of-distribution detection, adversarial example analysis, and model generalization. The speed and scalability of FLIPD, particularly for high-dimensional data like images from Stable Diffusion, is a significant advancement. It opens up avenues for future research, enabling the application of LID estimation in large-scale, complex settings previously intractable.
Visual Insights#

The figure illustrates the concept of Local Intrinsic Dimension (LID) using two examples: MNIST digits and LAION-Aesthetics images. The left panel shows a cartoon of how the number of factors of variation (LID) corresponds to complexity; simpler digits (1s) have fewer factors of variation than more complex digits (8s). The right panel shows examples of images from LAION-Aesthetics dataset, ordered by their LID scores obtained using the proposed FLIPD method on Stable Diffusion v1.5, demonstrating the method’s scalability and alignment with human perception of complexity.

This table presents a comparison of different local intrinsic dimension (LID) estimation methods on various synthetic datasets. The table shows the Mean Absolute Error (MAE) and concordance indices for each method, grouped by whether they are model-based (using generative models) or model-free. The best results in each metric for each group are highlighted in bold.
In-depth insights#
FLIPD: LID Estimator#
The proposed FLIPD (Fokker-Planck-based Local Intrinsic Dimension estimator) offers a novel approach to estimating LID (local intrinsic dimension) directly from a single pre-trained diffusion model. This contrasts with existing methods that often require multiple models or computationally expensive procedures. FLIPD leverages the Fokker-Planck equation associated with the diffusion model, providing a computationally efficient way to calculate LID. The method’s efficiency is particularly notable at scale, as demonstrated by its successful application to Stable Diffusion, a task previously intractable for other LID estimators. FLIPD’s ability to operate with a single, pre-trained diffusion model significantly simplifies its usage and enhances its practicality. However, the paper also acknowledges a sensitivity to network architecture, indicating potential limitations and areas for further research. Despite this sensitivity, FLIPD consistently shows a higher correlation with image complexity metrics than competing methods, suggesting its usefulness as a relative measure of complexity even with architectural variations. The method’s differentiability is highlighted as an important feature, opening avenues for future research involving backpropagation through LID estimates. Overall, FLIPD represents a significant advancement in efficient and scalable LID estimation.
DM-based LID#
The heading ‘DM-based LID’ suggests a research area focusing on estimating Local Intrinsic Dimension (LID) using Diffusion Models (DMs). This approach leverages the inherent properties of DMs, which learn data distributions, to infer the dimensionality of the underlying data manifold. DMs implicitly capture the manifold structure during training, making them suitable for LID estimation. A key advantage is the potential for efficiency, as pre-trained DMs can be directly used, avoiding the need for separate training or complex model-free calculations. However, challenges might involve the accuracy of LID estimates produced by DMs, and the sensitivity of the method to DM architecture. The effectiveness of a DM-based LID approach is highly dependent on the model’s ability to accurately represent the data’s underlying geometry. Additional research is needed to fully evaluate the robustness and accuracy of DM-based LID estimation across various datasets and complexities, and to address computational limitations for high-dimensional data.
UNet Architecture#
The section on “UNet Architecture” would likely detail the specific configuration of the U-Net used in the image LID estimation experiments. This would include crucial aspects such as the number of layers, the number of filters in each layer, the types of convolutional layers employed (e.g., standard convolutions, dilated convolutions), the use of skip connections, the inclusion of attention mechanisms, and the overall architecture’s depth. A key consideration would be how this architecture compares to those used in other diffusion models, and how this choice might influence the resulting LID estimates. Differences in architecture choice could significantly affect the sensitivity to high-frequency features, which might explain variations in LID estimates across model types. The discussion might also note that UNets, with their convolutional layers and skip connections, are generally better suited for handling image data than fully-connected networks, and are therefore a more natural choice for image-based LID estimation. The details provided would be critical for reproducibility and understanding the performance characteristics observed. Additionally, justification for the chosen architecture’s parameters (hyperparameters) would be important, perhaps comparing against common U-Net architectures in image generation tasks.
Synthetic Data#
The use of synthetic data in evaluating intrinsic dimension estimation techniques is crucial. Synthetic datasets offer complete control over the underlying data manifold’s properties, such as its dimension and complexity. This enables researchers to precisely assess the accuracy and robustness of their methods under controlled conditions. Unlike real-world datasets, synthetic data eliminates the confounding effects of noise, outliers, and unknown manifold structures that often obscure the true intrinsic dimension. By generating data with known intrinsic dimensions, researchers can directly compare estimated values to ground truth, providing a quantitative measure of performance. Careful design of synthetic datasets is essential, ensuring they accurately reflect the challenges of real-world data while maintaining the benefits of control and known ground truth. The choice of data generation techniques also influence the results, and this must be explicitly acknowledged. It’s also important to consider the limitations of synthetic data, acknowledging that it cannot fully capture the nuances and complexities of real-world data, despite providing a valuable testing ground.
Future Work#
The authors propose several avenues for future research. Extending FLIPD’s applicability to more complex architectures, like those found in advanced diffusion models, is crucial. The current sensitivity of FLIPD to the choice of architecture limits its generalizability and robustness. Addressing the observed multiscale nature of FLIPD is vital for improving the reliability and interpretability of LID estimates. Developing a theoretical understanding of this behavior will enhance the method’s practical applications. The researchers also suggest investigating the use of FLIPD in various applications, such as out-of-distribution detection and adversarial example analysis. Combining FLIPD with backpropagation, leveraging its differentiability, opens exciting possibilities for integrating intrinsic dimensionality into the training process of deep learning models. Finally, exploring the connections between FLIPD estimates and generalization in neural networks warrants further investigation. Addressing these aspects will strengthen FLIPD as a practical and reliable tool for assessing data complexity.
More visual insights#
More on figures

This figure visualizes FLIPD curves for two different synthetic datasets: a mixture of Gaussians and a string within a doughnut. The curves illustrate how FLIPD estimates vary as the hyperparameter t0 changes. Critically, the curves show a clear ‘knee’ at the true LID of the datasets, demonstrating that FLIPD reliably estimates the LID of data points.

This figure demonstrates the concept of Local Intrinsic Dimension (LID) using examples of MNIST digits (1s and 8s) and images from LAION-Aesthetics. The left panel illustrates how LID captures complexity: the 1s form a simpler, one-dimensional manifold, whereas the 8s form a more complex, two-dimensional manifold. The right panel shows examples of images with low and high LID values as estimated by the FLIPD method, highlighting its ability to capture perceived complexity.

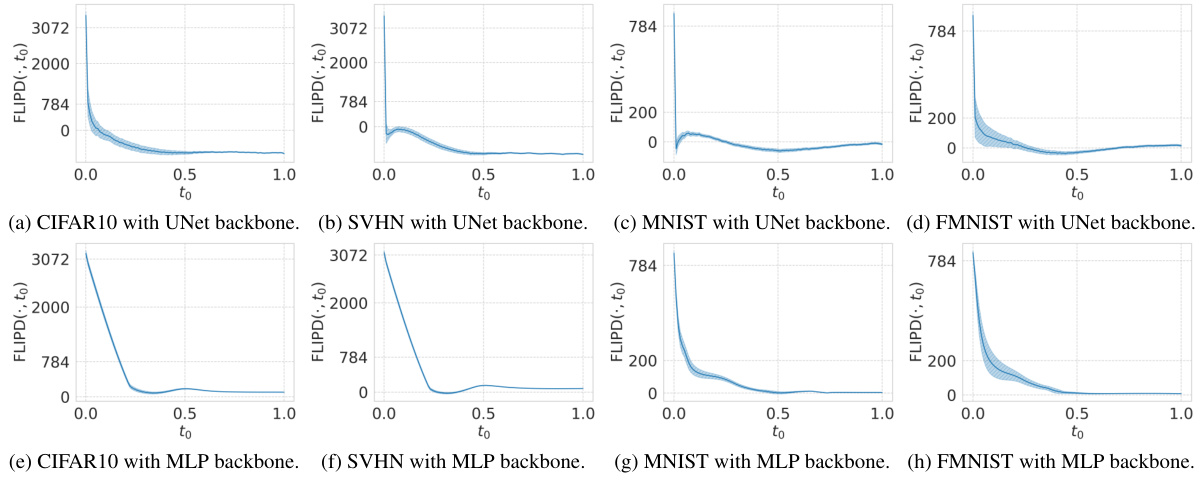
This figure shows an overview of image LID estimation using the proposed FLIPD method. It consists of three parts: (a) Shows the FLIPD curves, which illustrate how average LID changes with the hyperparameter to, for MNIST and FMNIST datasets using MLP backbones. (b) Presents images with low and high FLIPD estimates from FMNIST, MNIST, SVHN, and CIFAR10 datasets when using UNet backbones, highlighting the visual differences in complexity. (c) Shows high-resolution images from the LAION dataset, sorted by FLIPD estimates (to = 0.3) and PNG compression sizes, demonstrating the alignment of FLIPD with visual complexity assessments.

The figure shows that local intrinsic dimension (LID) is a natural measure of complexity. The left panel uses a cartoon illustration of MNIST digits ‘1’ and ‘8’ embedded in 3D space to show how the number of factors of variation relates to LID. The right panel shows examples from the LAION-Aesthetics dataset, illustrating how the proposed method, FLIPD, correlates with subjective assessments of complexity.

This figure shows the FLIPD curves for two different distributions: a mixture of three isotropic Gaussians with dimensions 2, 4, and 8, embedded in R10; and a ‘string within a doughnut’, which is a mixture of uniform distributions on a 2d torus and a 1d circle, embedded in R3. The curves show the FLIPD estimates (y-axis) as a function of the hyperparameter to (x-axis). The key observation is the presence of ‘knees’ in the curves, where the curve sharply changes its slope. The location of the knee corresponds to the true LID of the datapoints. This demonstrates the multiscale nature of the estimator and the effectiveness of using the knee-finding algorithm (kneedle) to automatically determine the optimal to value.

This figure visualizes FLIPD curves across different values of t0 for two synthetic datasets: a mixture of three isotropic Gaussians with dimensions 2, 4, and 8, embedded in R10; and a ‘string within a doughnut’, which is a mixture of uniform distributions on a 2D torus and a 1D circle embedded in R3. The plots show that, while initially inaccurate at t0 = 0 due to numerical instabilities in the DMs, FLIPD(x, t0) quickly stabilizes around the true LID for all data points as t0 increases, exhibiting a characteristic ‘knee’ pattern at the true LID value. This knee pattern is more pronounced in the ‘string within a doughnut’ example.
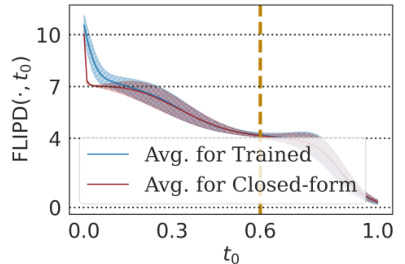
This figure visualizes the effect of the hyperparameter
toon the FLIPD estimates. Two different data distributions are used: a mixture of three isotropic Gaussians and a ‘string within a doughnut’ shape. Each curve represents the average FLIPD across data points with a specific true LID. The curves show a characteristic ‘knee’ where the estimate quickly stabilizes around the true LID for different values ofto. The multiscale nature of the estimator is illustrated. The figure shows that the method is sensitive to the hyperparameter but that it stabilizes around the true LID for sensible values.

This figure illustrates the concept of Local Intrinsic Dimension (LID) using two examples. The left panel shows a cartoon of 1s and 8s as manifolds in 3D space. The 1s manifold is simpler (1D), exhibiting only a ’tilt,’ while the 8s manifold is more complex (2D), having both a ’tilt’ and ‘disproportionality.’ The right panel displays images from the LAION-Aesthetics dataset, sorted by their LID values as estimated by the proposed FLIPD method applied to Stable Diffusion. This demonstrates FLIPD’s ability to capture relative complexity in high-dimensional data.
This figure demonstrates the concept of Local Intrinsic Dimension (LID) using two examples. The left panel shows a cartoon of 1s and 8s from the MNIST dataset, illustrating how the number of factors of variation corresponds to the LID (1 and 2 respectively). The right panel shows real-world examples from LAION-Aesthetics; images sorted by LID, visually showing a correlation between complexity and LID values, as estimated by the proposed FLIPD method.

This figure demonstrates the concept of Local Intrinsic Dimension (LID) using two examples: (Left) A simple illustration of 1s and 8s from MNIST dataset represented as manifolds with different dimensions in 3D space. This shows that LID reflects the number of factors of variations in data. (Right) Four images with lowest and highest LID scores from LAION-Aesthetics dataset, obtained using FLIPD method on Stable Diffusion v1.5. This part of the figure illustrates that FLIPD, as a method for estimating LID, correlates well with human perception of image complexity.

This figure demonstrates the concept of Local Intrinsic Dimension (LID) using two examples: MNIST digits and LAION-Aesthetics images. The left panel uses a cartoon to illustrate how LID represents complexity; a simple manifold (like the digit ‘1’) has fewer factors of variation than a complex one (like the digit ‘8’). The right panel shows real-world examples from the LAION-Aesthetics dataset, where images are ranked by their LID as estimated by FLIPD (the proposed method). This highlights the method’s ability to effectively capture subjective notions of image complexity.

The figure illustrates the concept of Local Intrinsic Dimension (LID) using two examples: MNIST digits and LAION-Aesthetics images. The left panel shows a cartoon representation of 1s and 8s as 1D and 2D manifolds respectively in 3D space, illustrating how LID reflects data complexity. The right panel shows real-world examples of images with low and high LID scores obtained using FLIPD on Stable Diffusion v1.5, showcasing its efficiency and alignment with human perception of complexity.
This figure illustrates the concept of Local Intrinsic Dimension (LID) using the MNIST dataset. The left panel shows a cartoon representation of two manifolds (1s and 8s) embedded in 3D space. The 1s manifold is simpler with only one degree of freedom (tilt), while the 8s manifold is more complex, having two degrees of freedom (tilt and disproportionality). The right panel shows images from the LAION-Aesthetics dataset, illustrating how FLIPD, the proposed method, captures the relative complexity of images as perceived by humans, with low LID values corresponding to simpler images and high LID values to more complex images. This demonstrates the efficiency of FLIPD for large, high-dimensional datasets.

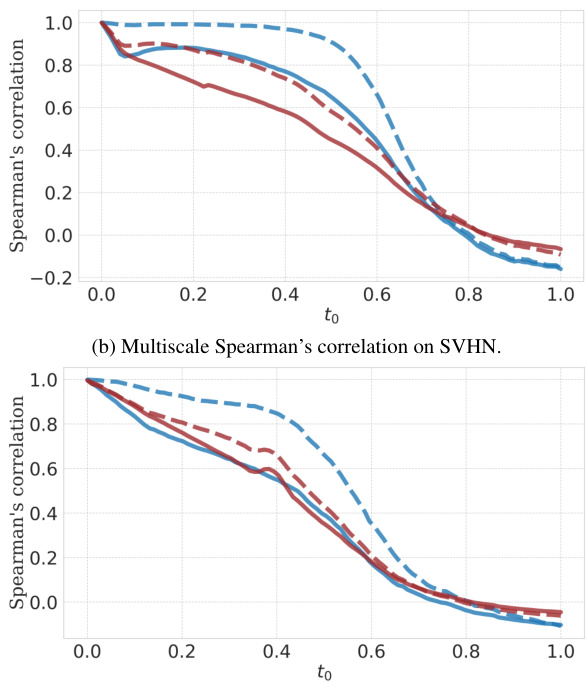
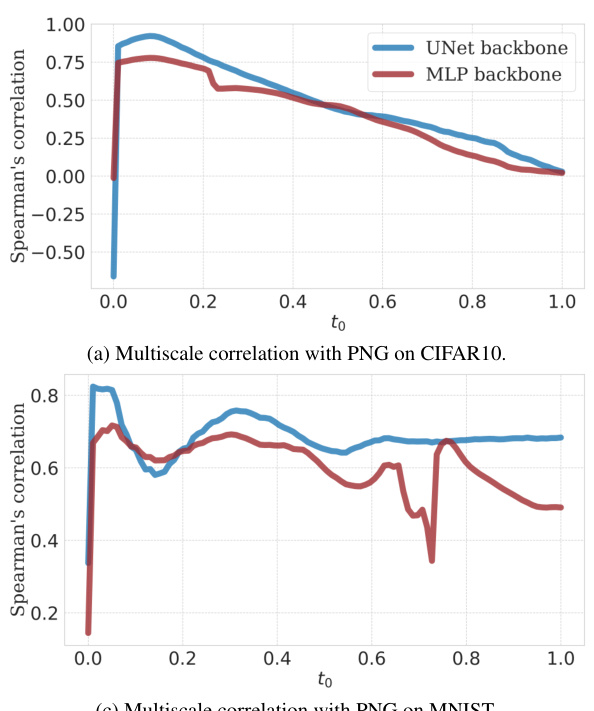
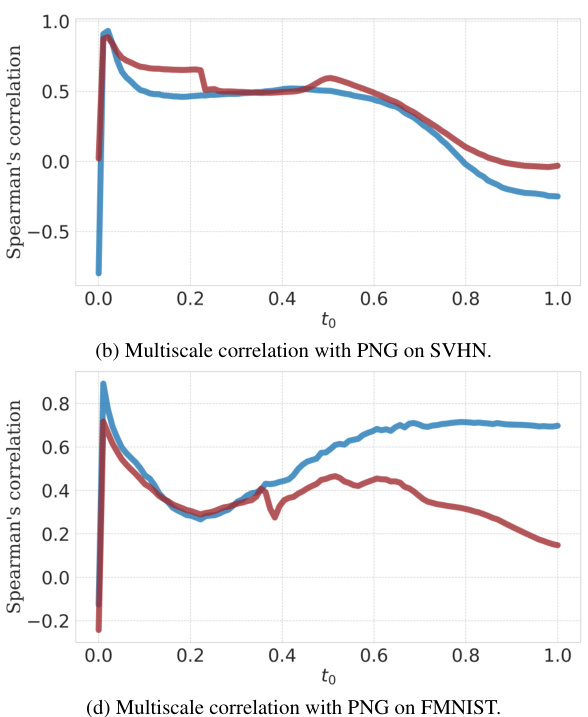
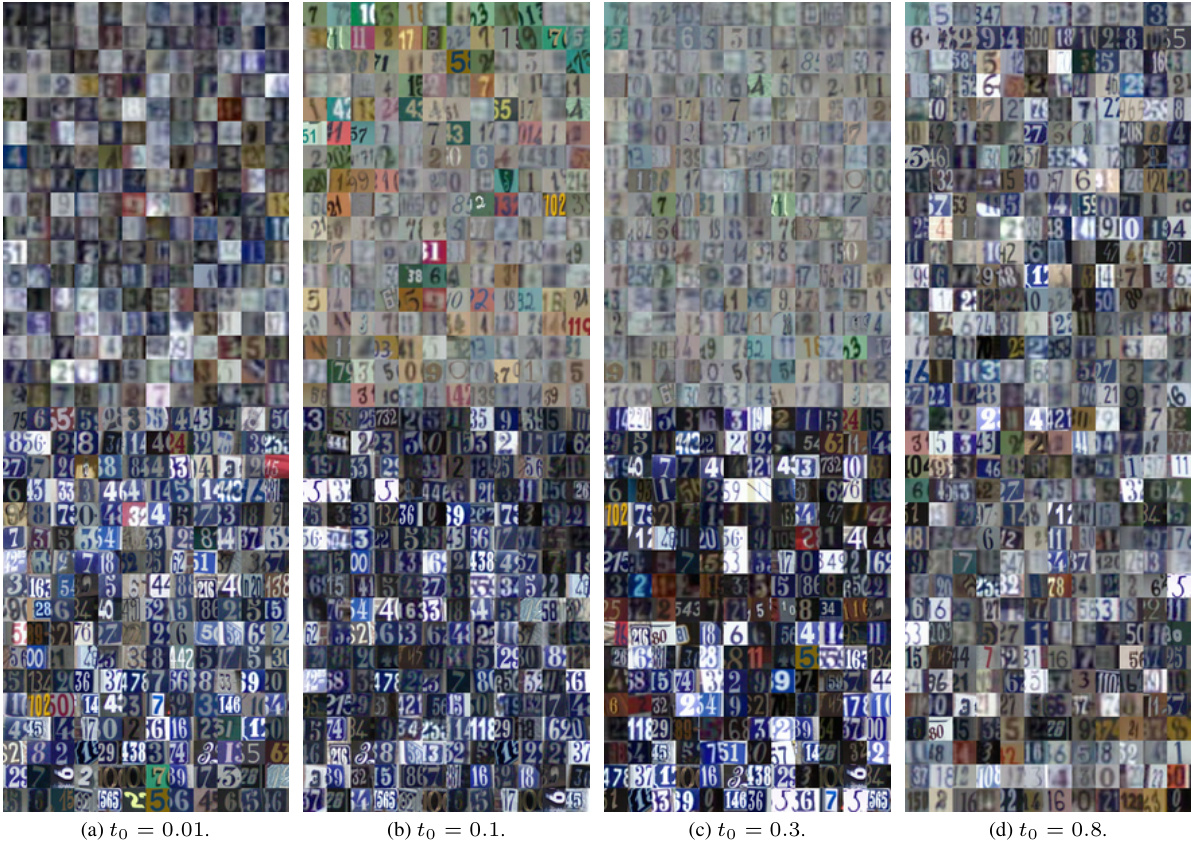
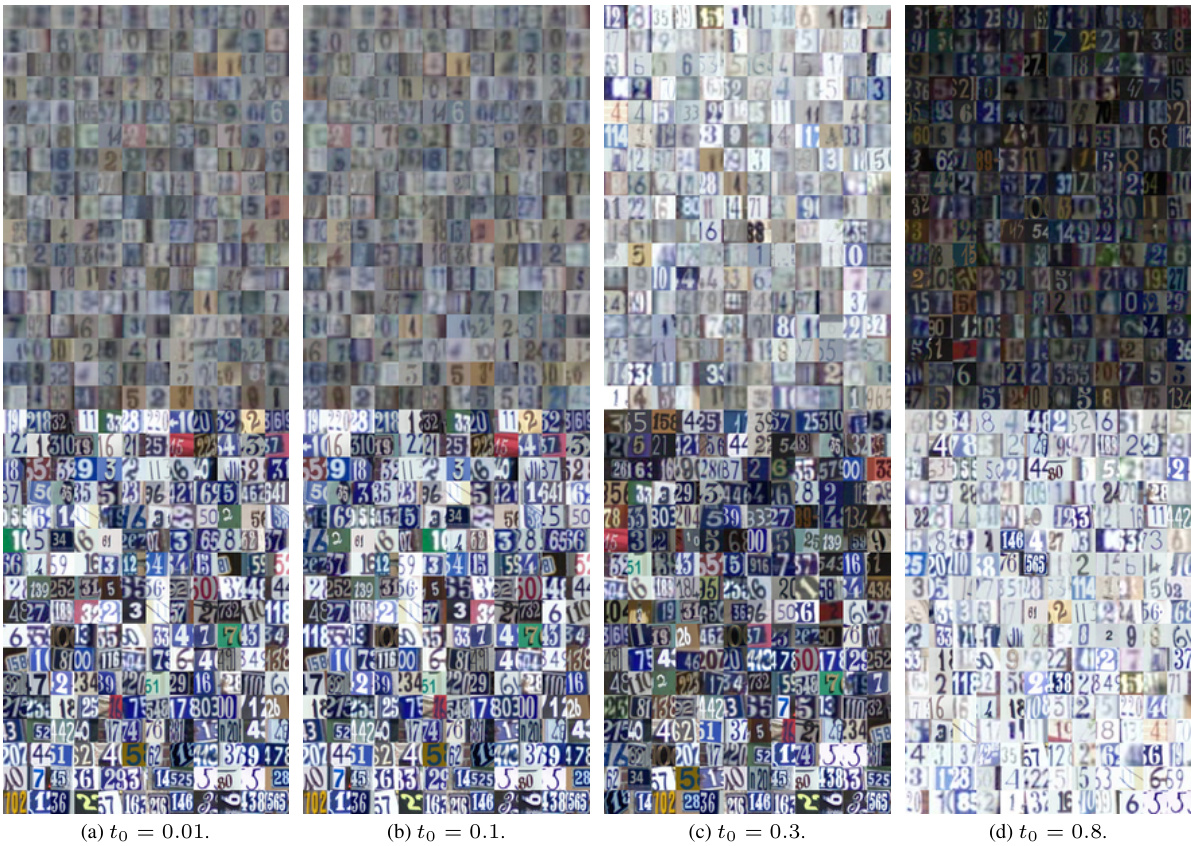
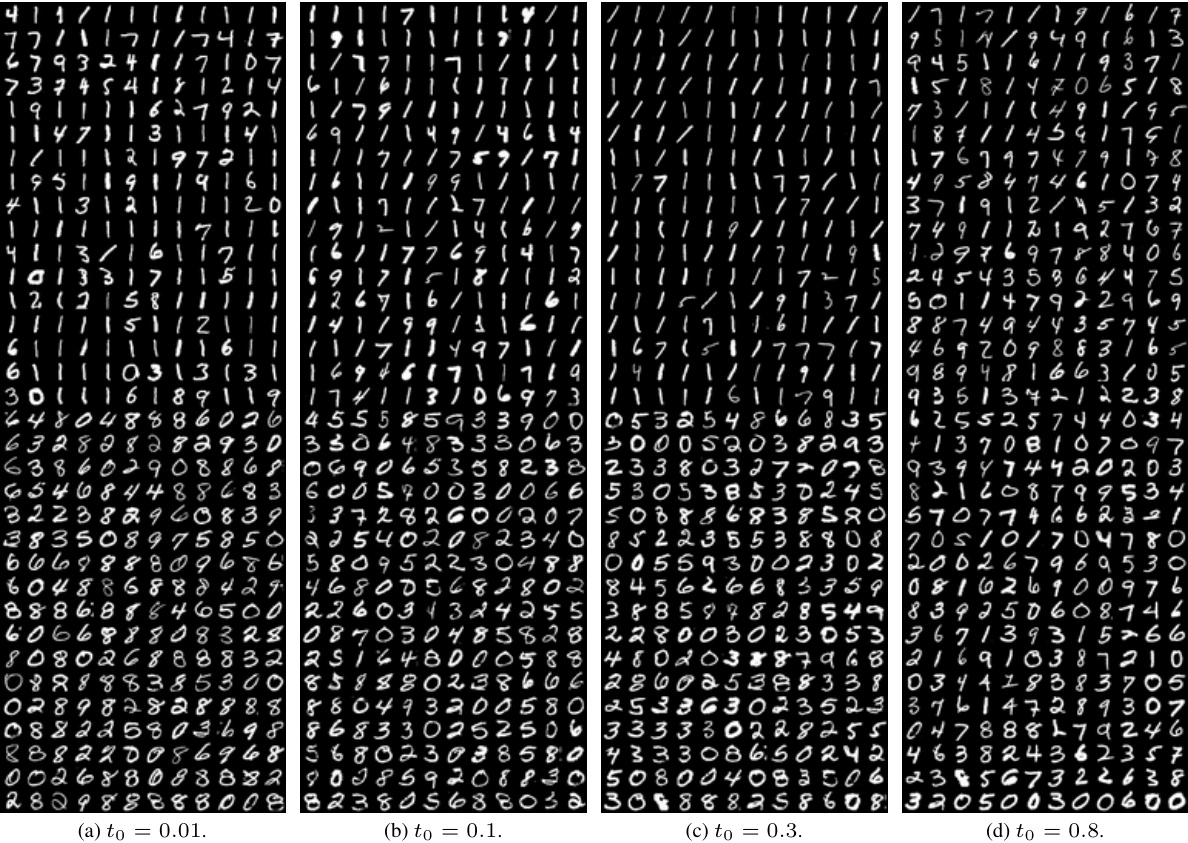
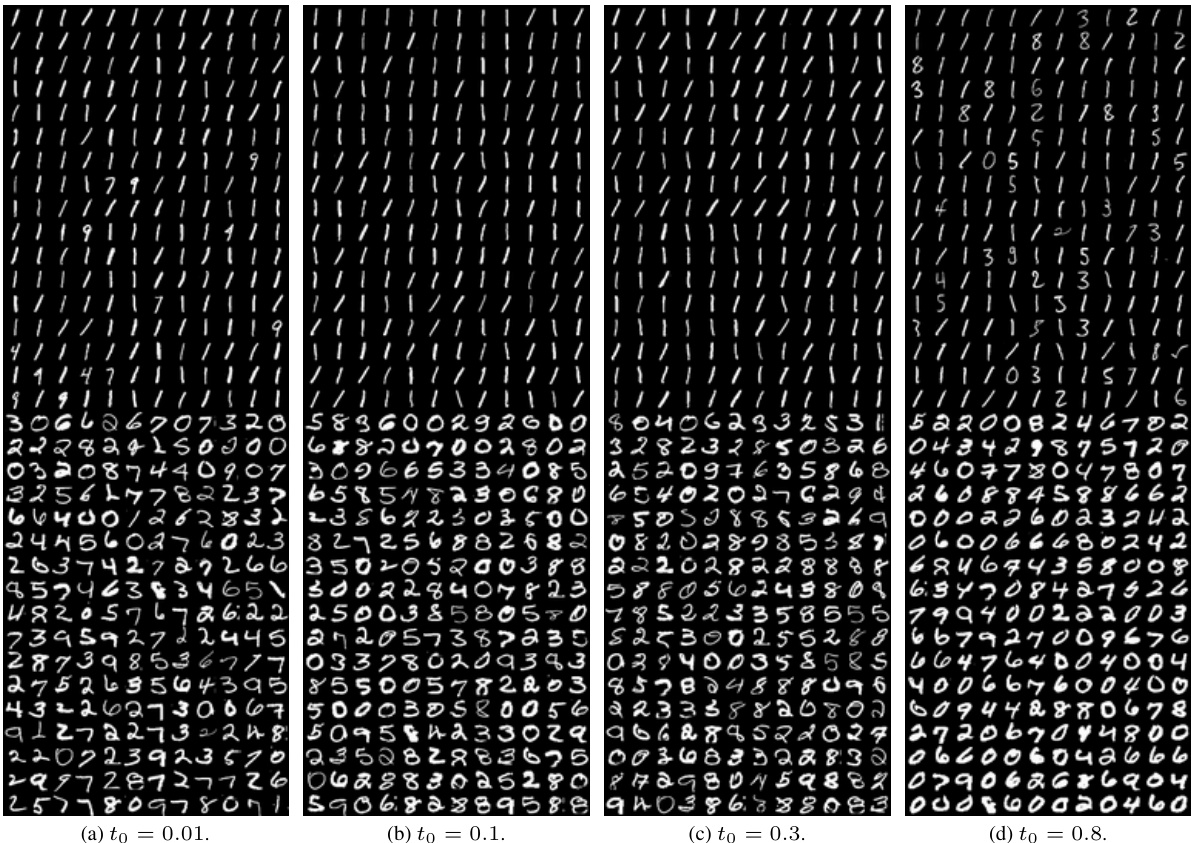
This figure displays the Spearman’s rank correlation between FLIPD estimates obtained using different numbers of Hutchinson samples (1 and 50) against the deterministic computation of the trace using D Jacobian-vector products. The correlations are evaluated at different values of t0 on four datasets using UNet and MLP backbones. The results show the impact of Hutchinson sample size and architecture choice on the accuracy and stability of FLIPD estimations.
The figure illustrates the concept of Local Intrinsic Dimension (LID) using two examples: MNIST digits and LAION-Aesthetics images. The left panel uses a cartoon to show how a 1-dimensional manifold (MNIST digit ‘1’) is simpler than a 2-dimensional manifold (MNIST digit ‘8’). The right panel shows real-world examples, demonstrating the correlation between FLIPD estimates (a new method introduced in the paper) and perceived image complexity.
The figure shows that the local intrinsic dimension (LID) is a measure of complexity. The left panel shows a cartoon illustrating how the LID reflects the number of factors of variation in data. The right panel shows real-world examples of images with low and high LID values, as estimated by the proposed method FLIPD.
The figure demonstrates the concept of Local Intrinsic Dimension (LID) using MNIST digits as an example. The left panel illustrates that simpler manifolds (like the digit ‘1’) have fewer factors of variation than more complex ones (like the digit ‘8’). The right panel shows examples of images from the LAION-Aesthetics dataset, ordered by their LID as estimated by the proposed method, FLIPD. This illustrates that FLIPD is capable of efficiently estimating LID for high-dimensional data, and its estimates correlate well with intuitive notions of image complexity.
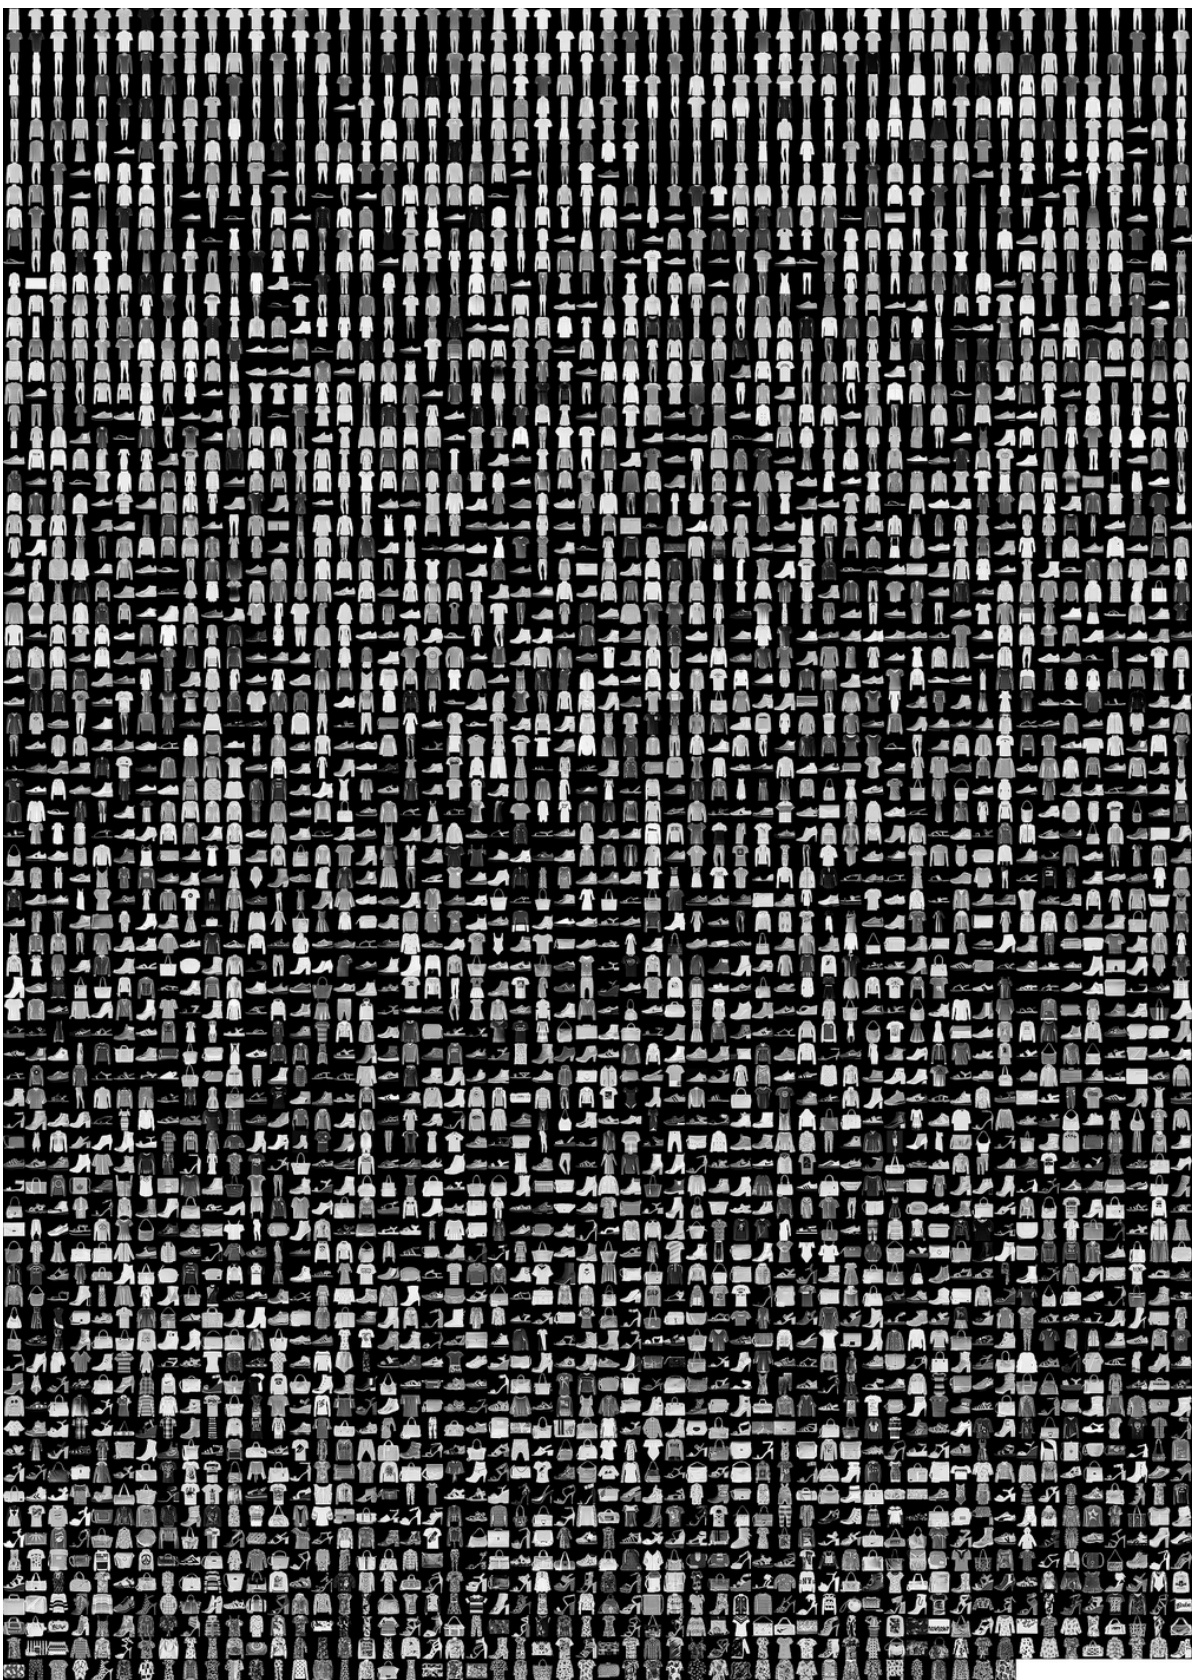
This figure shows 1600 images from the LAION-Aesthetics-625K dataset sorted according to their FLIPD scores (using to = 0.3). The sorting demonstrates that FLIPD, even when applied to high-resolution images and complex datasets like LAION, successfully ranks images by a measure of their relative complexity. Images with subjectively higher complexity (more detail, more interesting composition, etc.) tend to be placed towards the end of the sorted sequence.
This figure shows 1600 images from the LAION-Aesthetics-625K dataset sorted according to their FLIPD scores (intrinsic dimension) using Stable Diffusion, with to set to 0.3. The sorting demonstrates the ability of FLIPD to rank images based on their perceived complexity, with simpler images at the beginning and more complex images at the end. This provides a visual representation of how FLIPD can capture image complexity.
This figure demonstrates the concept of Local Intrinsic Dimension (LID) using two examples. The left panel shows a cartoon illustrating how LID reflects complexity. A 1 and an 8 are represented as manifolds in 3D space; the 1 has one degree of freedom (tilt) while the 8 has two (tilt and disproportionality), reflecting its higher LID. The right panel shows real-world examples from the LAION-Aesthetics dataset. Using FLIPD, images with the lowest and highest LID values are displayed, illustrating the method’s ability to capture complexity.
This figure demonstrates the concept of Local Intrinsic Dimension (LID) using two examples. The left panel shows a simplified illustration of how LID reflects data complexity: a 1-dimensional manifold (MNIST digit ‘1’) has a single degree of freedom (’tilt’), while a 2-dimensional manifold (MNIST digit ‘8’) has two (’tilt’ and ‘disproportionality’). The right panel showcases real-world examples from the LAION-Aesthetics dataset, illustrating how the FLIPD method (introduced in the paper) successfully identifies images with low and high LID values, which correlates with perceived image complexity.
This figure demonstrates the concept of Local Intrinsic Dimension (LID) using two examples. The left panel shows a cartoon illustration comparing the manifolds of MNIST digits ‘1’ and ‘8’. The manifold of ‘1’ is simpler, having only one factor of variation (tilt), while ‘8’ has two factors (tilt and disproportionality), illustrating how LID reflects complexity. The right panel shows real-world examples from the LAION-Aesthetics dataset. Images with the lowest and highest LID values as estimated by FLIPD (the proposed method) using Stable Diffusion v1.5 are displayed, highlighting the method’s ability to capture subjective complexity.
The left panel shows a cartoon illustration of how LID captures data complexity. Two manifolds representing MNIST digits ‘1’ and ‘8’ are shown embedded in 3D space. The ‘1’ manifold is one-dimensional (a line) and the ‘8’ manifold is two-dimensional (a surface). The complexity difference is reflected by the number of local factors of variation (LID). The right panel shows examples of images from the LAION-Aesthetics dataset, ranked by their LID according to the FLIPD method applied to Stable Diffusion v1.5, which shows a good correlation with perceived complexity.
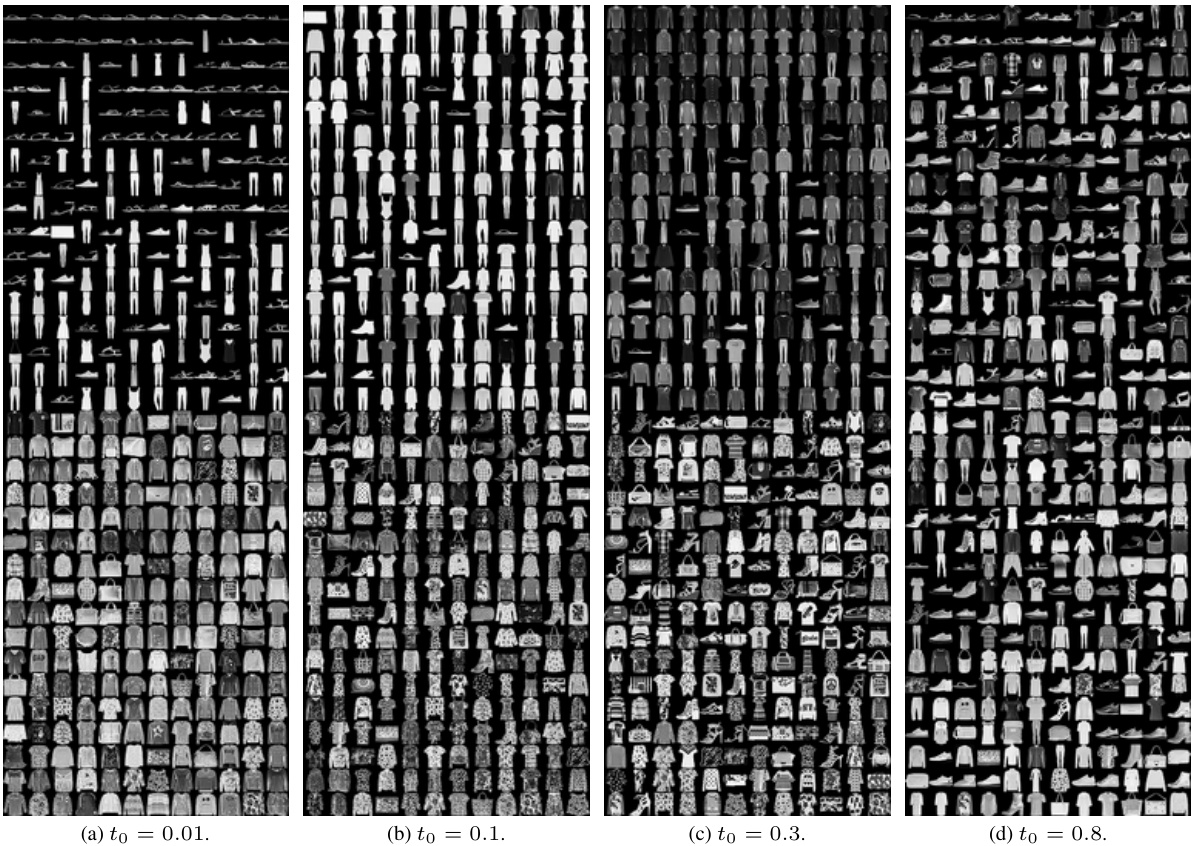
This figure shows 1600 images from the LAION-Aesthetics-625K dataset, sorted in ascending order according to their FLIPD (Fokker-Planck Local Intrinsic Dimension) estimates. The parameter to is set to 0.3. The ordering demonstrates the ability of FLIPD to rank images based on a measure of their complexity, aligning with intuitive notions of visual complexity. More complex images (with higher LID) appear later in the sequence.
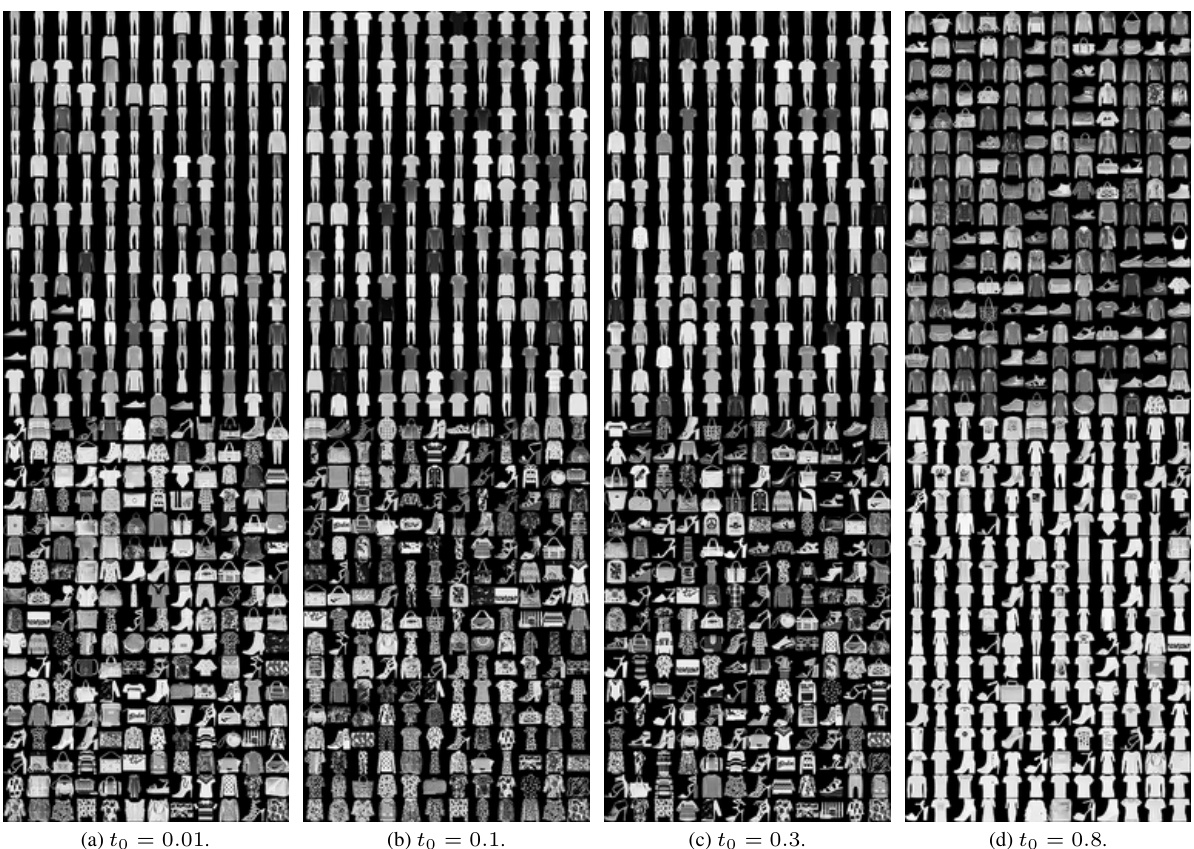
This figure shows 1600 images from the LAION-Aesthetics-625K dataset sorted according to their FLIPD scores (with to = 0.3). The images are arranged such that the simplest images (lowest FLIPD scores) are at the top left, progressing to the most complex images (highest FLIPD scores) at the bottom right. This visualization demonstrates that FLIPD can effectively rank images by their perceived complexity, even at a very large scale (1600 high-resolution images).

The figure shows two parts. The left part is a cartoon illustrating that the local intrinsic dimension (LID) is a natural measure of relative complexity by showing two manifolds of MNIST digits, 1s and 8s. The right part shows four images with the lowest LID and four images with the highest LID scores from a subsample of LAION-Aesthetics dataset. The LID scores are obtained using the proposed method FLIPD applied to Stable Diffusion model v1.5. The figure demonstrates that FLIPD aligns with the subjective complexity assessment.
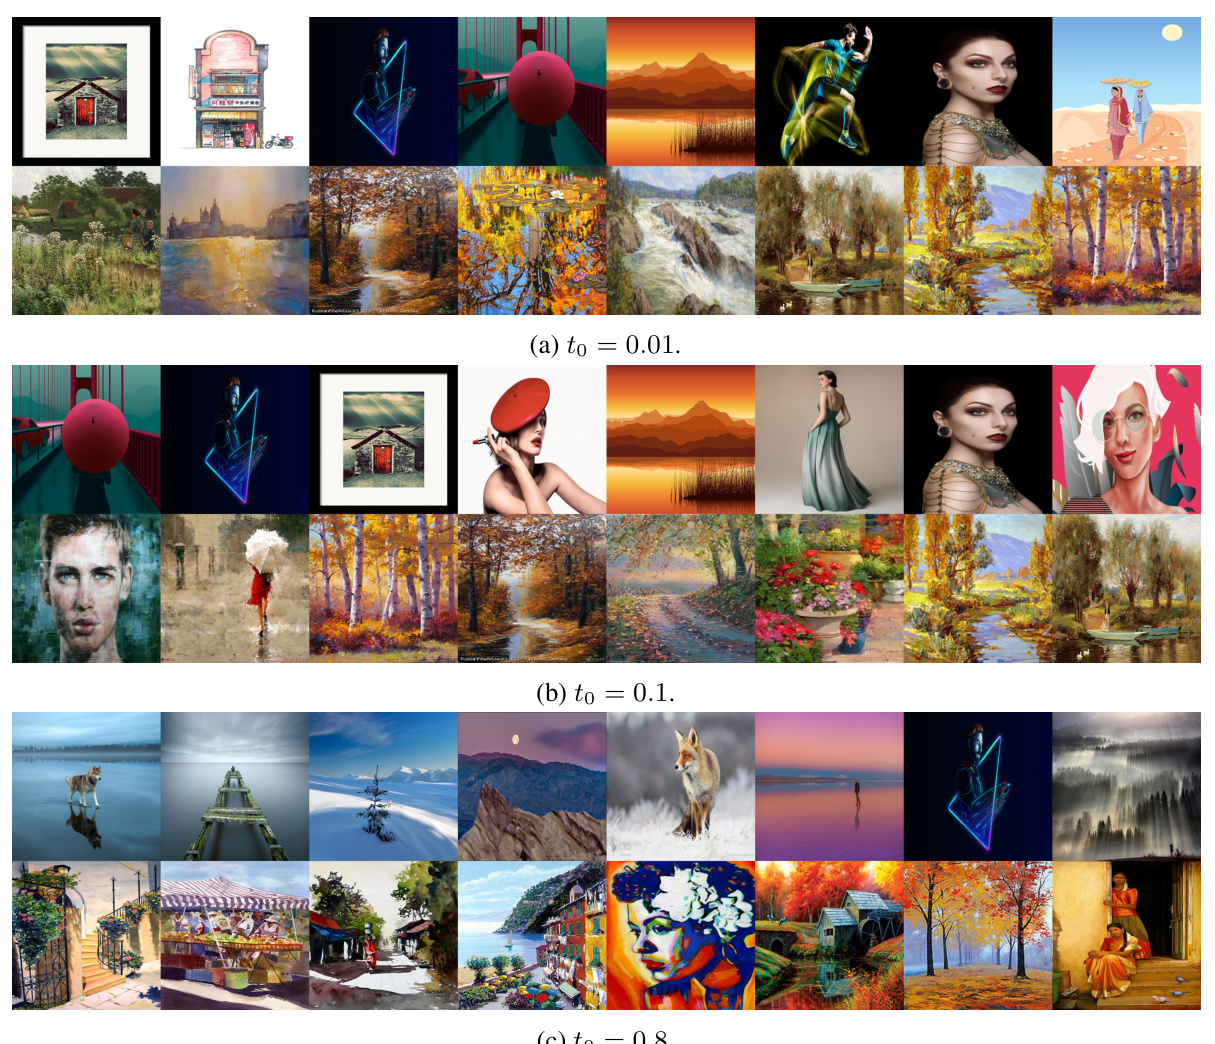
The left panel uses a cartoon to illustrate how LID can be understood as a measure of complexity. It shows two manifolds of MNIST digits, representing ‘1’s and ‘8’s. The manifold of ‘1’s is 1-dimensional (a single factor of variation, ’tilt’), while the manifold of ‘8’s is 2-dimensional (two factors, ’tilt’ and ‘disproportionality’). The right panel shows four of the lowest and highest LID datapoints from a subset of LAION-Aesthetics dataset, determined using FLIPD on Stable Diffusion v1.5, demonstrating FLIPD’s effectiveness in high-dimensional data and its alignment with visual complexity assessments.
More on tables

This table presents the Spearman’s rank correlation between LID estimates obtained from four different methods (FLIPD, NB, ESS, and LPCA) and the PNG compression size of images. The correlation values are provided for four image datasets (MNIST, FMNIST, CIFAR10, and SVHN). Higher correlation indicates a stronger relationship between the LID estimates and the image complexity as measured by compression size.

This table presents the time taken to compute LID for a single image using two different methods: FLIPD and NB. The time is measured in seconds and is broken down by dataset (MNIST/FMNIST, SVHN/CIFAR10, and LAION). The results highlight the significant computational advantage of FLIPD, especially for high-resolution images like those in the LAION dataset. NB is shown to be computationally intractable at the scale of Stable Diffusion.

This table compares the performance of various intrinsic dimension estimation methods on synthetic datasets. MAE (Mean Absolute Error) measures the average difference between estimated and true LID values. Concordance index assesses how well the methods rank the data points by LID. The table is organized by the type of manifold and estimation method (model-free or model-based). The best performing method in each category for each metric is highlighted in bold.

This table compares the performance of various LID estimation methods on synthetic datasets. It shows the mean absolute error (MAE) and concordance index for each method. The methods are grouped by whether they use generative models or not. The lowest MAE and highest concordance index values are shown in bold for each group, indicating the best-performing methods within each category.

This table presents the Mean Absolute Error (MAE) for various LID estimation methods. Lower MAE values indicate better performance. The rows represent different synthetic datasets with known LID, while the columns show results from FLIPD with two different to values (one using the kneedle algorithm to automatically determine to, and another fixed to = 0.05), and from FPRegress with two different settings (one using kneedle for automatic delta1 selection and another fixed δ₁ = -1). The table allows for a comparison of the different variations of the Fokker-Planck based estimator’s performance across various manifold complexities.

This table presents the Mean Absolute Error (MAE) of different LID estimation methods on various synthetic datasets. The datasets are categorized by their ambient dimension (the number of dimensions the data occupies in its embedding space), ranging from simple toy examples to high-dimensional datasets (800 and 1000 dimensions). Lower MAE values indicate better performance.

This table presents the concordance index for different LID estimation methods on various synthetic datasets. The concordance index measures how well the methods rank data points according to their true LID. A higher concordance index indicates better ranking performance. The results show that FLIPD consistently achieves perfect ranking accuracy across different datasets.
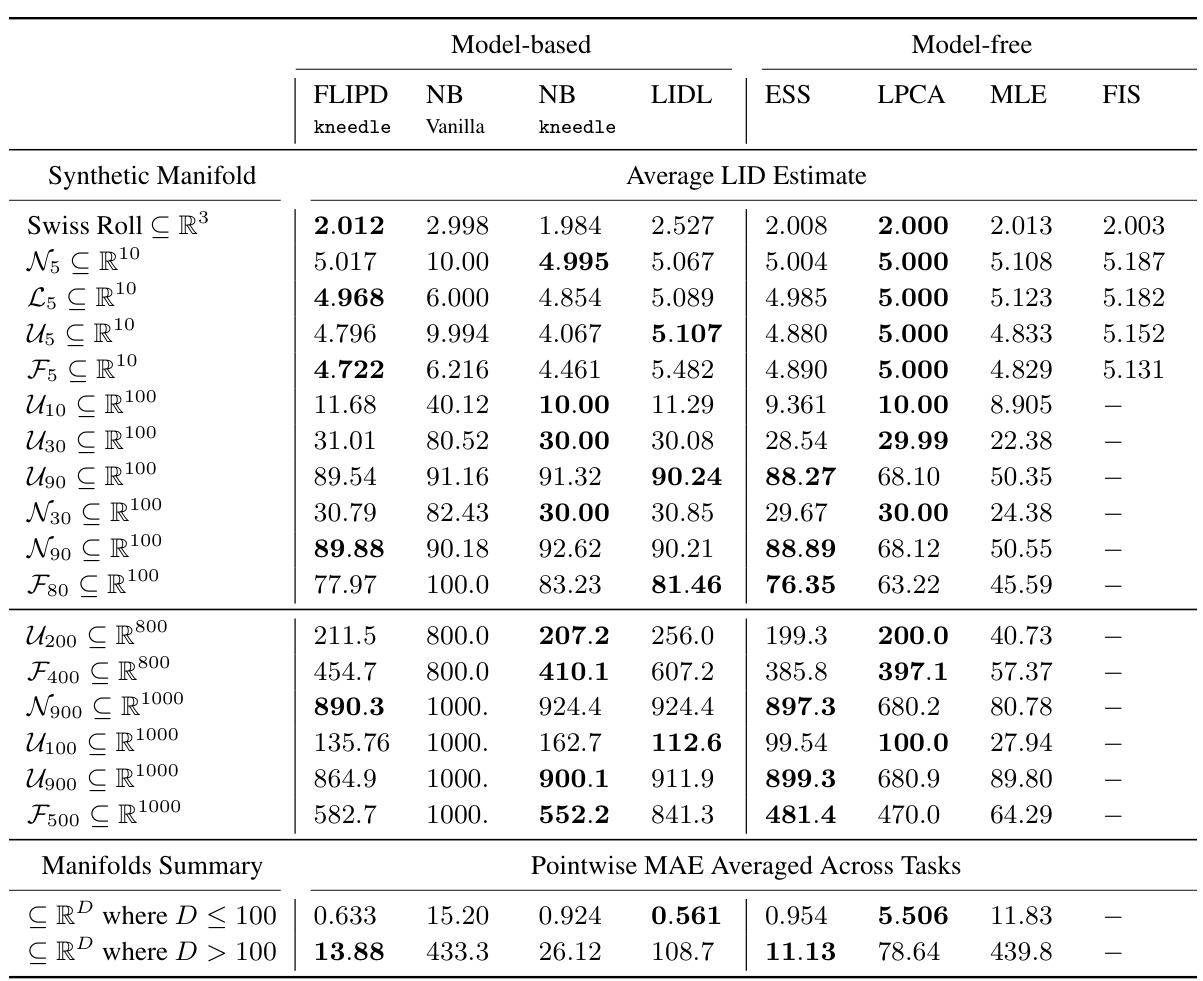
This table presents the Mean Absolute Error (MAE) for different LID estimation methods across various synthetic datasets. The datasets are categorized by ambient dimension (D), ranging from toy examples to high-dimensional data (D=800 and 1000). Lower MAE values indicate better performance.
Full paper#


