↗ OpenReview ↗ NeurIPS Proc. ↗ Chat
TL;DR#
Deep reinforcement learning (RL) models often struggle when trained sequentially on new tasks, exhibiting a phenomenon known as “plasticity loss.” This means the agent’s ability to learn new tasks degrades over time as it learns more, limiting the model’s adaptability. This is especially challenging in on-policy RL, where the model learns directly from its own interactions, limiting the flexibility to adapt to changing environments. The existing approaches developed for other RL settings (supervised learning, off-policy RL) fail to address this problem effectively in on-policy deep RL.
This research systematically investigates plasticity loss in the on-policy deep RL setting using various methods. They show that plasticity loss is significant in this setting, even with carefully designed distribution shifts in training data. Most of the existing interventions are not effective, highlighting the need for specific on-policy solutions. This study provides several criteria for mitigating plasticity loss. They introduce “regenerative” methods that address plasticity loss consistently across several different environments and types of distribution shifts in the training data. These methods prove more effective than existing approaches, showcasing their potential for building more robust and adaptable AI agents.
Key Takeaways#
Why does it matter?#
This paper is crucial because it addresses the pervasive issue of plasticity loss in on-policy deep reinforcement learning (RL), a significant challenge hindering the development of adaptable and robust AI agents. The findings offer novel insights and effective solutions, expanding the potential of on-policy RL for complex, real-world applications and opening avenues for future research in continual learning.
Visual Insights#

This figure shows three examples of gridworld environments used in the paper’s experiments. Each environment is a grid with walls (dark gray), positive reward locations (blue jewels), and negative reward locations (red jewels). The agent, represented by a black triangle, starts in the center of the grid and must navigate to collect rewards while avoiding the negative rewards and walls. The key point is that the placement of jewels and walls is randomized in each example, representing variations of the same type of task that the agent must learn to solve. These variations are used to simulate environmental distribution shift and investigate the impact on the agent’s plasticity (ability to adapt to new environments).
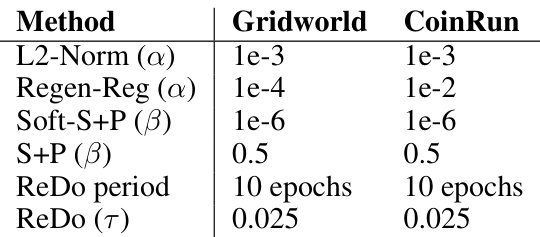
This table shows the optimal hyperparameter values for different methods (L2-Norm, Regen-Reg, Soft-S+P, S+P, ReDo) used in the experiments across different environments (Gridworld and CoinRun). The values were determined through a sweep of hyperparameter values using the permute environmental shift condition.
In-depth insights#
On-Policy Plasticity#
On-policy plasticity, the deterioration of a deep reinforcement learning agent’s ability to adapt to new tasks after encountering a sequence of training environments, presents a significant challenge. Unlike off-policy methods, on-policy algorithms train directly on the agent’s experienced data. This direct training approach, while offering stability, makes it susceptible to catastrophic forgetting, where prior knowledge is overwritten with new information. The paper investigates this problem by using gridworld tasks and more complex environments like Montezuma’s Revenge, highlighting the pervasiveness of plasticity loss. This research explores several intervention methods, including intermittent and continuous approaches. Importantly, it distinguishes between methods that succeed and those that fail, demonstrating that a class of “regenerative” methods consistently mitigates plasticity loss while preserving generalization performance. This finding underscores the importance of designing interventions that maintain a balance between adapting to new information and retaining crucial prior knowledge in the on-policy setting.
Mitigation Methods#
The research paper explores various methods to mitigate plasticity loss in on-policy deep reinforcement learning. Intermittent interventions, such as periodically resetting the final layer or scaling network weights, show limited success. Continuous interventions, which operate at every optimization step, are more promising. Regularization techniques, such as L2 regularization and Layer Normalization, consistently improve performance, suggesting that controlling the growth of network parameters during training is key. Novel architectural changes, like CReLU activations or plasticity injection, yield mixed results, highlighting the complexity of the problem. Regenerative regularization emerges as a particularly effective method, by encouraging model weights to remain close to their initial values. The study underscores the importance of considering both training performance and generalization when evaluating mitigation strategies and emphasizes the need for interventions that can adapt to various types of distribution shift.
Environmental Shifts#
The concept of “environmental shifts” in the context of continual learning is crucial. It explores how a model’s performance degrades when it encounters new data distributions that differ significantly from previously seen data. This degradation, known as plasticity loss, is a major challenge in online reinforcement learning. The paper likely investigates various types of environmental shifts, such as randomly permuting pixel data, introducing new tasks within the same environment, or gradually expanding the environment. These shifts test the model’s adaptability and robustness to changes in the underlying data generation process. A key aspect of the analysis would be determining which mitigation strategies are effective for each type of shift, revealing the relative difficulty of different forms of environmental change and potentially identifying common factors influencing plasticity loss. Ultimately, this work aims to improve understanding of and solutions for this critical issue in continual learning.
Regenerative Methods#
Regenerative methods, in the context of mitigating plasticity loss in continual learning, represent a powerful approach focusing on regularizing model parameters towards their initial state. Unlike methods that reset weights periodically, regenerative techniques continuously nudge parameters back, preventing drastic changes that hinder adaptation to new tasks. This approach is particularly effective because it balances the need for retaining previously learned knowledge with the ability to incorporate new information. The inherent stability of regenerative methods promotes generalization, reducing the risk of overfitting to recent data while preserving performance on older tasks. This strategy contrasts with approaches that introduce structural changes or merely reset parts of the network, offering a more general and elegant solution to the problem of plasticity loss. Importantly, the effectiveness of regenerative approaches highlights the importance of understanding how parameter drift affects learning dynamics and suggests a promising avenue for enhancing continual learning algorithms.
Future Directions#
Future research could explore several promising avenues. Extending the analysis to off-policy RL would provide a more comprehensive understanding of plasticity loss across different RL paradigms. Investigating the interaction between different types of distribution shift and their combined effect on plasticity loss is also crucial. Developing more sophisticated metrics for plasticity loss beyond simple reward degradation is needed. Metrics which account for the quality of generalization and the underlying representation learned by the agent could offer more nuanced insights. Furthermore, research focusing on the biological plausibility of observed phenomena is essential. Exploring the relationship between neural network architectures and their inherent capacity to preserve plasticity will be crucial. Finally, developing robust and generalizable methods for mitigating plasticity loss in practical applications is the ultimate goal. This includes addressing the challenges faced in high-dimensional, complex environments like those found in robotics and autonomous driving.
More visual insights#
More on figures

This figure shows the training and testing performance of a reinforcement learning agent in a gridworld environment under three different distribution shift conditions: Permute, Window, and Expand. The plots demonstrate the phenomenon of plasticity loss, where the agent’s performance degrades across rounds as the environment changes. Epoch-level and round-level performance metrics (normalized mean reward) are provided, along with standard error shaded regions for better visualization. The figure highlights that even with warm-started models, plasticity loss is prominent under the experimental distribution shifts.

This figure shows the correlation between various metrics (policy entropy, weight magnitude, weight difference, gradient norm, and dead units) and the normalized mean reward in a gridworld environment. The top section displays correlation plots showing the relationship between these metrics and both training and testing performance after ten rounds of experiments with various interventions. The bottom section shows the change in these metrics over the course of training for each intervention. Strong correlations (p<0.05) are highlighted in bold.

This figure presents the performance comparison of several intervention methods to mitigate plasticity loss against two baselines (warm-start and reset-all) in the Gridworld environment under three different distribution shift conditions: Permute, Window, and Expand. The performance is measured by the normalized mean reward, comparing both training and testing phases. It showcases that some methods consistently improve performance across various conditions, while others have inconsistent effects.

This figure shows the performance of different plasticity loss intervention methods compared to the baseline methods (warm-start and reset-all) in the Gridworld environment across three different distribution shift conditions (Permute, Window, Expand). The y-axis represents the normalized mean reward (normalized by the performance at the end of the first round) and the x-axis shows the different interventions. The top panel displays the training performance while the bottom panel shows the test performance. Error bars represent standard error. The results illustrate the effectiveness of various methods in mitigating plasticity loss in on-policy RL.

This figure compares the performance of three different approaches to training reinforcement learning agents on the Montezuma’s Revenge game. The x-axis represents the number of timesteps of training. The y-axis represents the cumulative reward achieved by the agent. The three lines represent different training methods: 1. Baseline: A standard RND agent trained without any plasticity-loss mitigation techniques. 2. Regenerative (L2): An RND agent trained with regenerative regularization (L2) to mitigate plasticity loss. 3. Soft shrink+perturb: An RND agent trained with the soft shrink+perturb method to mitigate plasticity loss. The shaded regions around each line represent the standard error, indicating the variability in performance across the twenty replicate experiments. The figure clearly shows that the two methods designed to mitigate plasticity loss (Regenerative (L2) and Soft shrink+perturb) yield significantly better performance than the baseline method, demonstrating the effectiveness of these techniques in combating plasticity loss in the challenging Montezuma’s Revenge environment.

This figure shows the performance of a model trained using Proximal Policy Optimization (PPO) in a gridworld environment under three different types of distribution shift: permute, window, and expand. The results demonstrate the presence of plasticity loss, which is characterized by a degradation in the model’s ability to fit new data as training progresses. The figure includes both epoch-level and round-level performance measures. The epoch-level plots provide a more fine-grained view of the learning process, while the round-level plots show a more concise summary of the performance at each round. The round-level plots also include standard error bars, which indicate the variability of the performance across different runs.
This figure shows the performance of different plasticity loss mitigation methods compared to a warm-start baseline in a gridworld environment. The experiment uses three types of distribution shifts: permute, window, and expand. For each shift, the figure presents both training and testing performance across multiple rounds. Shaded areas represent the standard error of the mean. The results highlight how different methods impact performance under different distribution shift scenarios, showing which methods effectively mitigate plasticity loss and improve generalization.

This figure displays the performance of different intervention methods in mitigating plasticity loss in a gridworld environment. The experiment uses three types of distribution shift: Permute, Window, and Expand. For each shift type, the training and test performance of each method is shown over ten rounds, comparing it to a warm-start baseline and a reset-all baseline. The shaded regions represent the standard error around the mean reward.

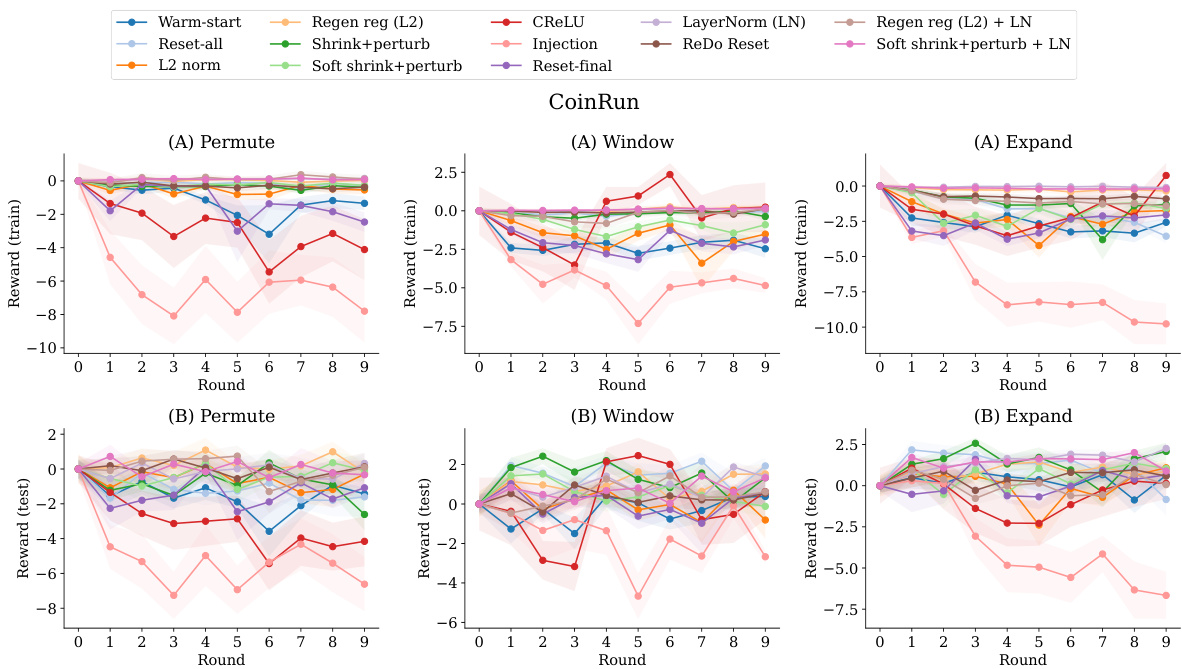
This figure presents the results of an experiment evaluating different methods for mitigating plasticity loss in the CoinRun environment, a procedurally generated game. The experiment is conducted with three different types of distribution shift (Permute, Window, Expand). Each type of shift is shown across two rows. The top row displays training performance (normalized mean episodic reward), and the bottom row displays testing performance (normalized mean episodic reward) across ten rounds of training. Each method’s performance is compared to a ‘warm-start’ baseline (training from a previously trained model) and a ‘reset-all’ baseline (re-initializing the model each round). The shaded area represents the standard error. This allows for a comparison of how well each method manages the plasticity loss (reduction in performance across rounds) compared to the baselines in training and testing performance under each distribution shift condition.

This figure shows the effect of different continual learning interventions on five diagnostic metrics across three different distribution shifts (Permute, Window, Expand). The metrics are: policy entropy, weight magnitude, weight difference, gradient norm, and dead units. Each metric is plotted against the round number, providing a visual representation of how these metrics evolve as the agent learns across multiple tasks under each condition. The shaded area represents the standard deviation across multiple experiment runs. The plots illustrate the impact of each intervention on plasticity and generalization performance.
More on tables
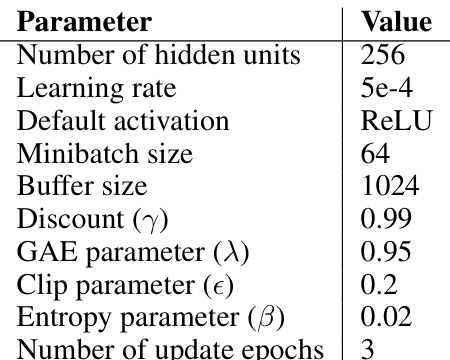
This table lists the hyperparameters used for the Proximal Policy Optimization (PPO) algorithm in the experiments conducted using the Gridworld and CoinRun environments. The hyperparameters include the number of hidden units, learning rate, activation function, minibatch size, buffer size, discount factor, GAE parameter, clip parameter, entropy parameter, and number of update epochs. These values were used as defaults across all experiments involving these two environments.

This table presents the results of a generalized linear model (GLM) used to predict the training reward based on five diagnostic metrics: entropy, weight magnitude, weight difference, gradient norm, and dead units. The GLM coefficients, standard errors, z-scores, p-values, and 95% confidence intervals are shown for each metric. The results show the statistical significance of each metric in predicting the training reward.
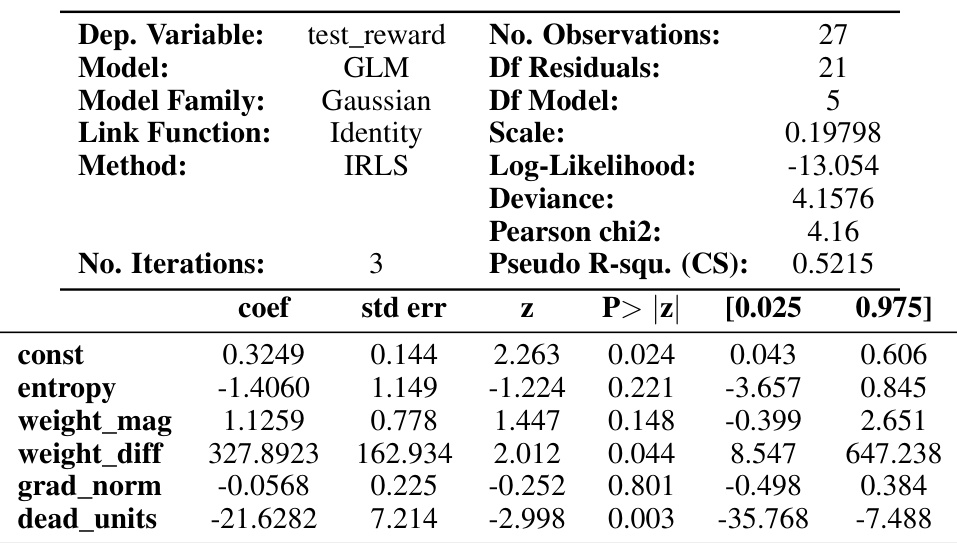
This table presents the results of a generalized linear model (GLM) used to predict the reward on a test dataset. The GLM uses five diagnostic metrics (entropy, weight magnitude, weight difference, gradient norm, and dead units) as independent variables to predict the normalized reward as the dependent variable. The table shows the coefficients, standard errors, z-scores, p-values, and 95% confidence intervals for each metric.
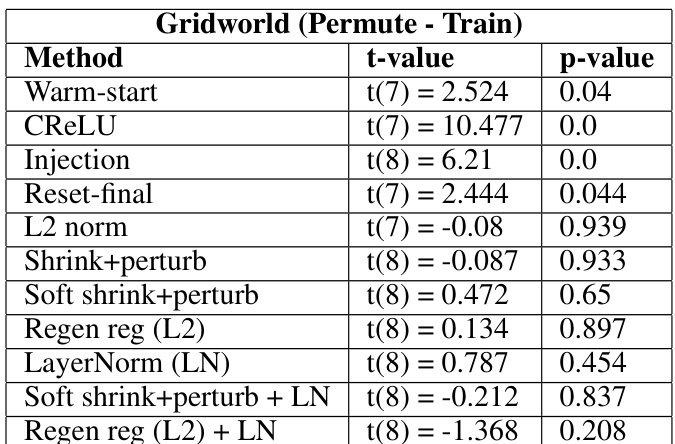
This table presents the results of statistical tests comparing various plasticity loss mitigation methods against a baseline method (reset-all) in the Gridworld environment using the permute condition. The t-values indicate the difference in performance between each method and the baseline, while the p-values show the statistical significance of these differences. Negative t-values suggest improved performance compared to the baseline, and p-values less than 0.05 indicate statistical significance.

This table presents the results of statistical tests comparing different plasticity loss mitigation methods to a baseline method (reset-all) in the Gridworld environment under a specific distribution shift condition (window). It uses t-values and p-values to show the statistical significance of the differences in training performance between each method and the baseline. T-values below zero indicate that the method performs better than the baseline, while positive values indicate the opposite. P-values above 0.05 suggest no statistically significant difference between the method and the baseline.
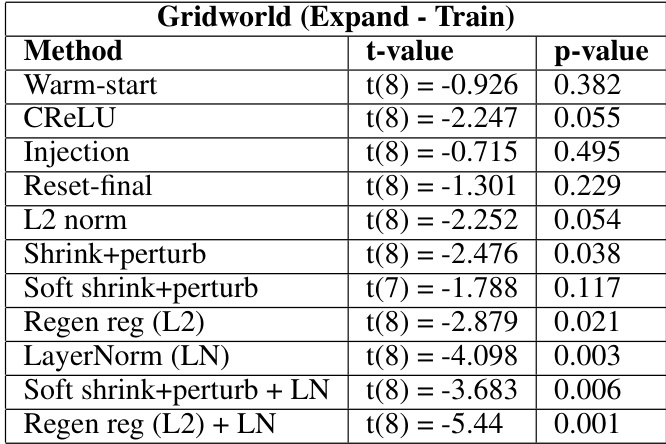
This table presents the results of statistical tests comparing various methods to a baseline method (reset-all) in a gridworld environment with an ’expand’ condition. The t-values indicate the difference between the method and the baseline, with negative values suggesting better performance than the baseline. p-values indicate the statistical significance of these differences, with p < 0.05 typically indicating a statistically significant difference.
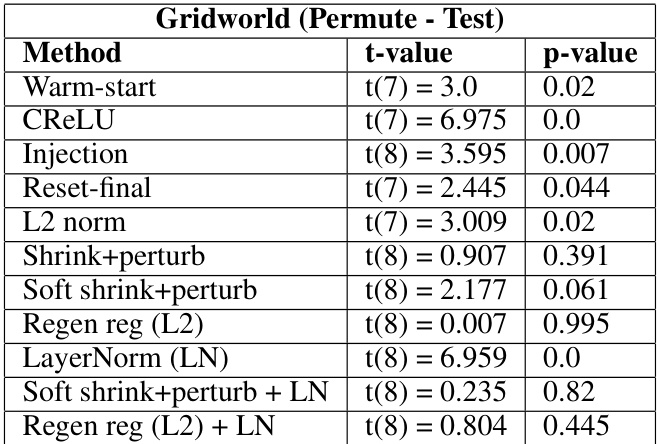
This table presents the results of statistical tests comparing the performance of different plasticity loss mitigation methods to a baseline method (reset-all) in the gridworld environment using the permute test condition. The t-values indicate the difference in performance between each method and the baseline, while the p-values indicate the statistical significance of these differences. A p-value less than 0.05 typically indicates a statistically significant difference. Positive t-values show worse performance than baseline and negative values indicate better performance. Methods with p-values above 0.05 show no statistically significant difference compared to the baseline.

This table presents the statistical significance tests comparing different methods against the reset-all baseline in the Gridworld environment with the Window distribution shift condition. It shows the t-values and p-values for each method, indicating whether the performance difference from the reset-all baseline is statistically significant. A p-value above 0.05 suggests no significant difference in performance.
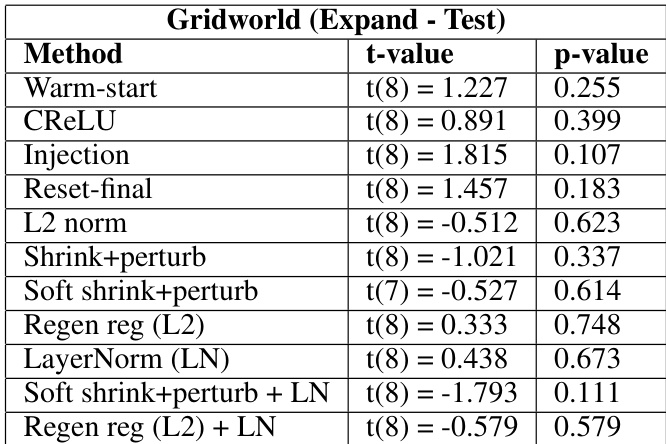
This table presents the results of statistical tests comparing different methods for mitigating plasticity loss to a baseline method (reset-all) in a gridworld environment with an expand distribution shift. The tests focus on the performance on unseen data (test distribution). Negative t-values indicate that a method performs better than the baseline, while positive t-values indicate worse performance. The p-values indicate the statistical significance of the differences.
Full paper#


