↗ OpenReview ↗ NeurIPS Proc. ↗ Chat
TL;DR#
Reinforcement Learning (RL) often struggles with effective exploration, particularly in sparse reward environments. Current methods for quantifying state novelty using L p norms or bisimulation metrics have limitations in scalability and accuracy. These methods often rely on count-based episodic terms or suffer from approximation inaccuracies in metric learning, hindering performance in challenging scenarios.
The proposed Effective Metric-based Exploration-bonus (EME) solves these issues. EME employs a new metric for evaluating state discrepancy with theoretical guarantees, and a diversity-enhanced scaling factor dynamically adjusts exploration bonuses based on reward model variance. Experiments across diverse environments demonstrate EME’s superior performance and scalability compared to existing methods, highlighting its potential to significantly advance RL exploration.
Key Takeaways#
Why does it matter?#
This paper is crucial for RL researchers as it addresses critical limitations in existing exploration methods. EME’s improved metric and scaling factor significantly enhance exploration efficiency, especially in complex environments. The theoretical analysis and diverse experimental results offer valuable insights for designing more robust and scalable exploration strategies. It opens up new avenues for investigating improved metric learning and diversity-enhanced scaling techniques in RL.
Visual Insights#

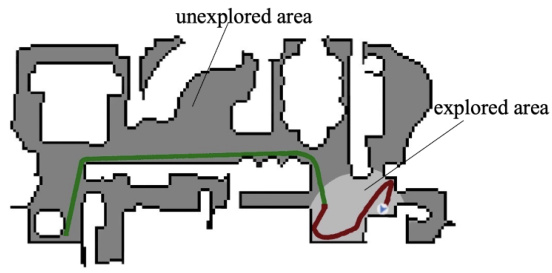
This figure compares the trajectories of reinforcement learning agents trained with three different exploration methods in a real-world indoor environment. (a) shows the trajectory of an agent using an episodic count-based method with Lp norm for evaluating state discrepancy. (b) shows the trajectory of an agent using a bisimulation metric-based method. (c) shows the trajectory of an agent using the proposed Effective Metric-based Exploration-bonus (EME) method. The figure highlights that EME allows the agent to explore a significantly larger area compared to the other two methods.

This table compares four different exploration methods, including the proposed EME method. It highlights the objective function of each method, showing how state discrepancy and a scaling factor are used to calculate an exploration bonus. The table also notes whether each method uses episodic counts, has an approximation gap, and has good scalability.
In-depth insights#
Effective Metric Exploration#
Effective metric exploration in reinforcement learning (RL) aims to improve the agent’s ability to discover novel states by intelligently guiding its exploration process. This is particularly crucial in sparse-reward environments where traditional methods struggle. A key challenge lies in defining an effective metric to quantify the difference between states, balancing the need for novelty with computational efficiency. Robust metrics that accurately capture behavioral differences are vital, while avoiding approximations that compromise theoretical guarantees. Additionally, dynamic scaling factors are necessary to adjust exploration bonuses based on the current state of learning, ensuring effective exploration even in challenging scenarios where subtle state distinctions might be missed. The success of effective metric exploration thus depends on the synergy between a well-defined metric and a scalable, adaptive scaling mechanism.
Atari, MiniGrid, Habitat#
The evaluation of the proposed exploration method across diverse simulated environments, namely Atari, MiniGrid, and Habitat, is a crucial aspect of the research. Atari games offer a benchmark for evaluating performance in discrete action spaces with high-dimensional visual input. MiniGrid provides a controlled, grid-world setting for evaluating exploration strategies in more simplified environments that still present challenges. Habitat, a photorealistic simulation of indoor environments, tests the scalability and generalizability of the method in complex, realistic scenarios. The use of these diverse environments allows for a comprehensive assessment of the method’s strengths and weaknesses in handling different levels of complexity and realism. The comparative results across these environments reveal the method’s robustness and effectiveness. Combining these benchmarks allows for a complete and thorough examination of the algorithm’s potential.
EME’s Robust Metric#
The effectiveness of the Effective Metric-based Exploration bonus (EME) hinges critically on its robust metric for evaluating state discrepancy. Unlike prior methods relying on approximations of the bisimulation metric or Lp norms with count-based scaling, EME directly addresses the approximation gap and scalability limitations. It achieves this by rigorously defining a new metric that directly incorporates the expected reward difference between states, a behavioral similarity measure using KL divergence on policy distributions, and avoids approximations of Wasserstein distance. This theoretically grounded approach ensures a closer connection to value differences, leading to more effective exploration, particularly in challenging scenarios where subtle state differences exist. The dynamic adjustment of the exploration bonus based on prediction variance from an ensemble of reward models further enhances its adaptability and robustness, ensuring that exploration is dynamically amplified when needed, even in hard exploration settings.
Scalability Challenges#
Reinforcement learning (RL) exploration strategies often face scalability challenges. Count-based methods, relying on episodic visit counts, struggle in environments with many unique states, limiting their applicability to complex, real-world scenarios. Approximation errors in bisimulation metrics, used to evaluate state discrepancy, create a theory-practice gap, especially for hard exploration tasks where state differences are minimal. This gap undermines the theoretical guarantees and leads to ineffective exploration. High computational costs associated with certain metrics further restrict scalability, preventing their application to large-scale or complex problems. The challenges highlight the need for exploration bonuses that are robust, theoretically sound, computationally tractable, and applicable across diverse environments, regardless of state space characteristics and task difficulty.
Future Explorations#
A section titled ‘Future Explorations’ in a research paper would naturally delve into promising avenues for extending the current work. Given the paper’s focus on enhancing exploration in reinforcement learning via effective metric-based exploration bonuses, several directions seem particularly pertinent. One key area would be investigating more sophisticated metrics beyond the proposed EME, perhaps exploring information-theoretic measures or those incorporating temporal aspects of state transitions. This could lead to even more robust and effective exploration strategies, especially in complex, high-dimensional environments. Another compelling avenue would be extending the framework to handle continuous action spaces, moving beyond the discrete action settings examined in the paper. This requires adapting the metric learning and exploration bonus calculation to handle continuous action distributions. Furthermore, a thorough investigation into the interplay between the exploration bonus and the reward function itself is crucial. A deeper understanding of this relationship could enable more effective and efficient reward shaping techniques. Finally, applying the EME framework to real-world robotic tasks beyond the simulated environments studied would be a significant validation of its practicality and robustness. This would likely involve addressing challenges related to sensor noise, real-time computation constraints, and the inherent uncertainties of real-world interactions.
More visual insights#
More on figures

The figure shows the results of different exploration methods on three Robosuite tasks: Door Opening, Table Wiping, and Pick-and-Place. The x-axis represents the number of training steps (in millions), and the y-axis shows the mean success rate achieved by each method. Shaded regions represent standard deviations. The plot visually compares the performance of EME against several baselines, illustrating its superior performance across all three tasks.

This figure compares the performance of EME against other baseline methods across various challenging Atari games known for their difficulty in exploration. The x-axis represents the number of frames (training steps), and the y-axis shows the average game score per episode. The shaded areas likely represent the standard deviation across multiple runs. The figure aims to visually demonstrate EME’s superior learning efficiency and ability to achieve higher average scores compared to other methods.

This figure presents the results of the exploration tasks conducted in the Habitat environment. It compares the performance of EME against several baselines (ICM, RND, RIDE, NovelD, E3B, LIBERTY) across three different tasks: CloseCab, OpenFridge, and Rearrange. The y-axis shows the mean success rate, and the error bars represent the standard deviation over five seeds. The figure visually demonstrates the superior performance of EME compared to other methods in achieving higher success rates across the three tasks.

This figure shows example visual observations from the Habitat environment. It showcases the type of data used by the RL agents to learn navigation: RGB images, semantic segmentation maps (identifying object types), and depth maps (distance to objects). These multi-modal observations make the Habitat environment particularly challenging for exploration, as subtle changes in the scene are significant.

This ablation study shows the effect of the maximum reward scaling factor M on the performance of the EME algorithm across three Robosuite tasks: Door Opening, Table Wiping, and Pick-and-Place. Different values of M (1, 5, 10, 20, 40) were tested, with M=10 used as the default. The results demonstrate the optimal range of M and how this hyperparameter affects exploration and learning efficiency. The shaded regions represent standard deviations across multiple runs.

This figure shows the ablation study on the ensemble size of reward models used in the EME method. The x-axis represents training timesteps, and the y-axis represents the mean success rate for three different Robosuite tasks: Door Opening, Table Wiping, and Pick-and-Place. Different lines represent the results using different ensemble sizes (ES = 3, 6, 9, 12). The shaded area around each line represents the standard deviation. The red line shows the best performing baseline for comparison. The results indicate that increasing the ensemble size improves performance up to a certain point (ES=9), after which the performance starts to decrease slightly. This demonstrates a trade-off between accuracy of reward variance prediction and exploration.

This figure shows the results of different exploration methods on three manipulation tasks in Robosuite. The x-axis shows the number of training steps (in millions), and the y-axis shows the mean success rate achieved by each method. Shaded areas represent standard deviations. EME consistently outperforms other methods across all three tasks, demonstrating its effectiveness in continuous control environments.

This figure compares the performance of the proposed EME method and its variants (using different feature encoders) across multiple challenging Atari games. It shows the average return achieved by each method over time, illustrating the impact of the feature encoder on exploration effectiveness. The results demonstrate how the choice of feature encoder affects the learning and exploration performance in diverse Atari game environments.

This figure shows the trajectories of different reinforcement learning agents trained with various exploration methods in a Habitat environment. The different colors represent the paths taken by agents using EME, EME-Static (EME without dynamic scaling), EME-EP (EME with episodic count scaling), ICM, RND, RIDE, NovelD, E3B, and LIBERTY. The figure visually demonstrates that the EME algorithm explores a significantly larger area of the environment compared to the other methods.

This figure compares the performance of EME against several baselines on three different exploration tasks within the Habitat environment. The tasks are CloseCab, OpenFridge, and Rearrange. The y-axis represents the mean success rate, showing the percentage of successful task completions. Error bars indicate standard deviation across multiple trials. The results demonstrate EME’s superior performance and scalability in comparison to other methods.

The figure shows the results of different reinforcement learning algorithms on three challenging Robosuite tasks: Door Opening, Table Wiping, and Pick-and-Place. The x-axis represents the number of training steps (in millions), and the y-axis shows the mean success rate achieved by each algorithm. Error bars indicate standard deviations. The graph visually compares the performance of EME against several baselines, illustrating its superior performance in successfully completing these challenging robotic manipulation tasks.

This figure compares the performance of three variations of the EME algorithm on three Robosuite tasks: Door Opening, Table Wiping, and Pick-and-Place. The variations are the full EME algorithm, EME without the dynamic scaling factor, and EME using an episodic count as the scaling factor. The x-axis shows the number of training steps (in millions), and the y-axis displays the mean success rate, with shaded areas representing standard deviations, indicating performance variability. The results illustrate how the dynamic scaling factor in the full EME method contributes to improved performance over simpler alternatives.

The figure shows the mean success rates for three challenging Robosuite manipulation tasks (Door Opening, Table Wiping, Pick and Place) across different exploration methods. The x-axis represents the number of training steps (in millions), and the y-axis shows the mean success rate, with shaded regions indicating standard deviation. The figure demonstrates the superior performance of EME (Effective Metric-based Exploration Bonus) compared to other baseline methods over time.

This figure compares the trajectories of three different reinforcement learning agents trained with different exploration methods in a real indoor environment. The agents are trained using (a) a count-based method with Lp norm, (b) a bisimulation metric-based method, and (c) the proposed Effective Metric-based Exploration-bonus (EME) method. The figure visually demonstrates how the EME method explores a much larger portion of the environment compared to the other two methods.

The figure displays three different visual observation modalities provided by the Habitat simulator: RGB image, semantic segmentation, and depth map. The RGB image shows a realistic view of an indoor scene. The semantic segmentation depicts the scene with different color-coded regions corresponding to object classes. The depth map provides a visual representation of the scene’s distances from the viewpoint, often represented by a color gradient.

This figure compares the trajectories of three different exploration methods in a real-world indoor environment. Method (a) uses an episodic count-based approach with Lp norms, (b) uses a bisimulation metric-based approach, and (c) uses the proposed EME method. The figure visually demonstrates the superior exploration coverage achieved by the EME method compared to the other two approaches.
More on tables

This table compares the mean success rates of several exploration methods (RIDE, RIDE without episodic term, NovelD, NovelD without episodic term, LIBERTY) across three different environments (Robosuite, MiniGrid, Habitat). The results highlight the significant impact of the episodic count term on the performance of RIDE and NovelD, especially in complex environments. LIBERTY shows comparatively better performance in most of the cases.

This table presents the average testing results of various MiniGrid environments for the proposed Effective Metric-based Exploration Bonus (EME) method and several other baseline methods. The environments are categorized into different types (Multi-Room, Key Corridor, and Obstructed Maze), each with variations in size and complexity. For each environment, the mean success rate (with standard deviation) is shown for each method. The results illustrate the performance of EME compared to other approaches on these challenging exploration tasks.

This table presents the average testing results for various MiniGrid environments. The results compare the performance of the proposed Effective Metric-based Exploration bonus (EME) method against several other baseline methods (ICM, RND, RIDE, NovelD, E3B, LIBERTY). Each environment is tested across five different seeds, providing a measure of the robustness of each method’s performance. The table shows the mean success rate and standard deviation for each method in each environment. The MiniGrid environments vary in complexity and challenge the agent’s exploration capabilities.

This table shows the average testing results of different MiniGrid environments for the proposed EME method and other baseline methods. The results are presented as mean ± standard deviation for various MiniGrid environments, categorized by the type of maze (Multi-Room, Key Corridor, Obstructed Maze) and the presence or absence of added noise (e.g., -NT for Noisy TV). Each environment represents a different challenge in terms of exploration difficulty. The table highlights the relative performance of EME compared to other methods like ICM, RND, RIDE, NovelD, E3B and LIBERTY across various exploration scenarios. The results demonstrate EME’s superior performance across many of the tested environments, indicating the effectiveness of the proposed method in hard exploration tasks.

This table compares four different exploration methods: RIDE, NovelD, LIBERTY, and the proposed EME method. It highlights the key differences in their approaches to evaluating state discrepancy (the core of their exploration bonus) and their scalability. Specifically, it shows how RIDE and NovelD rely on simple Lp norms and episodic visit counts, while LIBERTY uses the more complex bisimulation metric (which often requires approximation). The table emphasizes that the EME method addresses the limitations of prior approaches by proposing a more robust and theoretically grounded metric, along with a novel diversity-enhanced scaling factor.

This table lists the hyperparameters used in the Robosuite experiments. It includes settings for horizon steps, control frequency, state and action dimensions, controller types, maximum reward scaling, maximum training steps, actor and critic learning rates, batch size, discount factor, soft update weight, alpha learning rate, hidden layer sizes, returns estimation steps, buffer size, and steps per update. Different parameters are specified for each of the three Robosuite environments: Pick and Place, Door Opening, and Table Wiping.

This table compares different existing metric-based exploration methods (RIDE, NovelD, LIBERTY) with the proposed EME method. It highlights the key differences in their approaches to state discrepancy evaluation, scaling factor, episodic approximation gap and scalability. The table clearly shows how EME addresses the limitations of existing methods, particularly focusing on its resilient metric and diversity-enhanced scaling factor.

This table compares several state-of-the-art exploration methods that leverage state discrepancy measures. It highlights the differences in how they quantify state discrepancy, the scaling factors used, and their approximation gaps and scalability. The table also introduces the proposed EME method and its components for comparison.

This table compares several existing metric-based exploration methods with the proposed EME method. It highlights the key differences in how they calculate state discrepancy (the core novelty measure for exploration), the scaling factors used to adjust the exploration bonus, and the potential limitations of each approach regarding approximation gaps and scalability. The table also lists the objective function for each method to show the different ways state discrepancy and scaling factor are combined to incentivize exploration.
Full paper#


