↗ OpenReview ↗ NeurIPS Proc. ↗ Chat
TL;DR#
Traditional reinforcement learning (RL) struggles with goal-directed planning due to the vastness of state and goal spaces. Humans and animals effectively use intermediate goals to handle long-horizon tasks, a capability lacking in most RL algorithms. Existing methods for incorporating subgoals often rely on pre-defined representations or are computationally expensive, hindering their applicability to complex real-world scenarios.
This research introduces a novel ‘goal-reducer’ mechanism that overcomes these limitations. The goal-reducer efficiently extracts high-quality subgoals from experience, without needing prior environmental knowledge. It integrates seamlessly with existing RL frameworks, demonstrably accelerating performance on several tasks. Importantly, the goal-reducer’s activity patterns closely match human brain activity during similar tasks, particularly in areas associated with planning and goal-directed behavior, suggesting a biologically plausible model of human cognition.
Key Takeaways#
Why does it matter?#
This paper is crucial because it bridges the gap between classical reinforcement learning limitations and human goal-directed learning. By introducing a novel goal reduction mechanism, it offers a biologically plausible model that accelerates RL performance, matching human brain activity patterns, and opening new avenues for both computational and neuroscience research. Its impact extends to various fields, including robotics, AI planning, and cognitive science, providing a more efficient and human-like approach to problem-solving.
Visual Insights#

This figure illustrates the core ideas behind the paper’s proposed goal reduction method. Panel A shows how a goal-reducer module can be integrated with a policy network to generate actions by reducing complex goals into simpler subgoals. Panel B presents three different subgoal sampling strategies: random sampling, trajectory sampling, and loop-removal sampling. The loop-removal sampling strategy is the paper’s main contribution, which aims to improve subgoal quality by removing loops or redundancies from the sampled trajectories. Panel C demonstrates how the filtration radius impacts trajectory connectivity, and Panel D provides an example of a proper filtered trajectory compared to an original random walk in a 3D space, illustrating the effectiveness of the loop-removal sampling method.

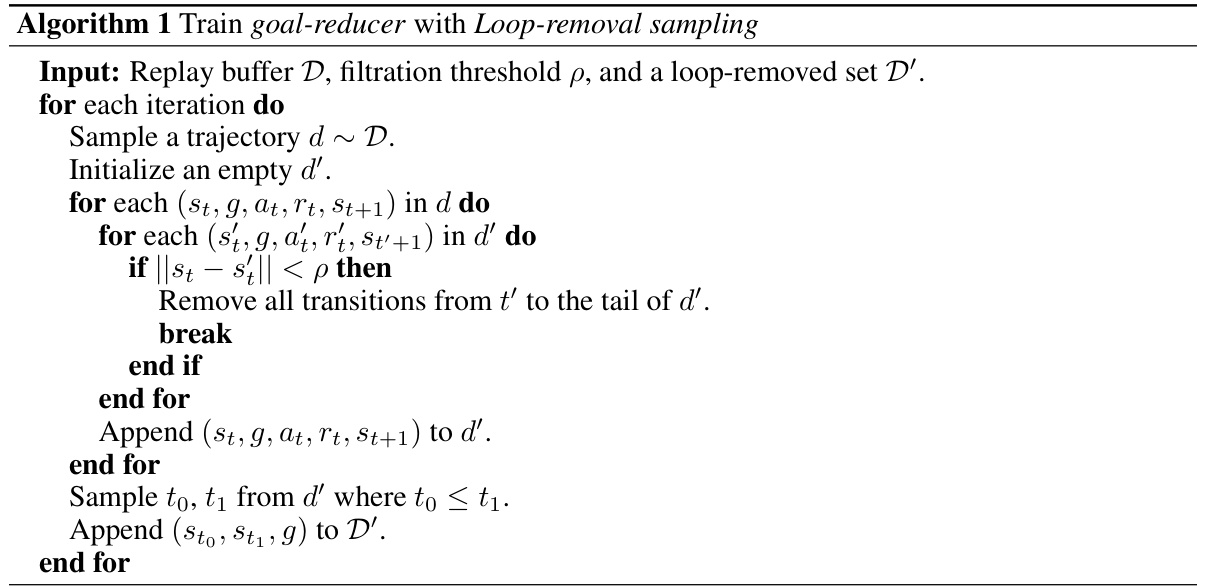
This table lists the hyperparameters used in the Loop-removal sampling method described in Appendix A.2 of the paper. It specifies values for learning rate, batch size, and the maximum number of epochs during training of the goal-reducer.
In-depth insights#
Goal Reduction RL#
Goal Reduction RL presents a novel approach to reinforcement learning (RL), tackling the challenge of long-horizon, complex tasks. Instead of directly learning a policy for the ultimate goal, it introduces a mechanism to recursively decompose complex goals into simpler subgoals. This subgoal generation process leverages experience replay, particularly a novel technique called “loop-removal sampling,” which efficiently filters out redundant or cyclical experiences to guide the identification of effective subgoals. This approach accelerates RL performance in various tasks significantly, showing faster convergence and improved overall effectiveness compared to standard RL methods. Furthermore, the study demonstrates that this goal reduction process is computationally efficient and bears remarkable resemblance to how the human brain, specifically vmPFC and basal ganglia, approaches goal-directed behavior, suggesting a possible biologically plausible computational framework for human problem-solving.
Loop Removal#
The concept of ‘Loop Removal’ in the context of goal-directed reinforcement learning is a crucial innovation. It addresses the challenge of inefficient exploration by filtering out redundant state transitions within an agent’s experience. Unlike random or trajectory-based subgoal sampling, loop removal focuses on identifying and eliminating cyclical patterns in the agent’s trajectory, thus promoting more direct and efficient navigation towards the goal. This technique is particularly valuable in environments with sparse rewards, where random exploration is often unproductive. By removing loops, the algorithm effectively distills high-quality subgoals from the agent’s experience replay buffer, leading to faster convergence and improved performance. Furthermore, this method is computationally efficient and doesn’t require explicit knowledge of the environment’s structure, making it robust and scalable to various tasks. The success of loop removal highlights the importance of intelligently managing and utilizing an agent’s experience for efficient goal-directed learning.
Brain Activity#
The study’s investigation into brain activity focuses on the correlation between a computational model of goal-directed behavior and human brain activity during a treasure-hunt task. Using fMRI data, the researchers found that activity in the ventromedial prefrontal cortex (vmPFC) and basal ganglia corresponded to the model’s components responsible for goal representation and subgoal generation. This suggests that humans might use a similar computational framework for goal-directed behavior as the model, employing a hierarchical structure for planning that involves subgoal decomposition. The vmPFC’s role in value and goal representation, along with the putamen’s involvement in habitual and goal-directed actions, are discussed as further support for this framework. The study highlights the potential of integrating computational models with neuroscience data to enhance our understanding of human cognition.
Recursive Subgoals#
The concept of “Recursive Subgoals” in goal-directed reinforcement learning presents a powerful paradigm for tackling complex tasks. It suggests that decomposing a large, challenging goal into a hierarchy of increasingly simpler subgoals can significantly improve the efficiency and effectiveness of learning. This recursive decomposition allows an agent to learn and master manageable sub-tasks, building upon this knowledge to solve more intricate problems. The method’s strength lies in its ability to scale to large state spaces by focusing on local interactions and subgoal associations. This approach is particularly appealing as it mirrors the human problem-solving process, where we instinctively break complex tasks into smaller, more manageable steps. However, it’s crucial to carefully manage the complexity and potential for infinite recursion during subgoal generation and evaluation. Effective subgoal identification methods are essential for the success of this technique, and developing methods that efficiently and accurately assess subgoal quality is a key area of future research.
Limitations#
A thoughtful analysis of limitations in a research paper is crucial for assessing its overall validity and impact. Addressing limitations demonstrates a critical and self-aware approach to research, acknowledging potential weaknesses and biases that may affect the results or interpretations. Identifying limitations often involves examining methodological choices, such as sample size, data collection methods, and statistical analyses. The discussion of limitations should not be an afterthought but an integral part of the research process, allowing for future improvements and more robust research designs. A thorough exploration of limitations also highlights areas where further research is needed, providing valuable insights for future studies and contributing to a more comprehensive understanding of the research topic. By explicitly acknowledging limitations, researchers demonstrate their commitment to rigorous and transparent scientific practice, fostering trust and credibility in their findings.
More visual insights#
More on figures

This figure shows the training results of a goal-reducer using three different sampling strategies: random sampling, trajectory sampling, and loop-removal sampling. The results are shown for two different environments: a geometric random graph and a four-room gridworld. The plots show the training loss, Optimality, and Equidex metrics over time. Optimality and Equidex measure the quality of the subgoals generated by the goal-reducer. The figure also shows how Optimality and Equidex change when the goal-reducer is applied recursively. Loop-removal sampling consistently outperforms the other two methods.

This figure presents the results of experiments demonstrating the effectiveness of the goal-reducer in accelerating standard reinforcement learning (RL) algorithms across different tasks. Panel A shows a comparison of the performance of the standard Deep Q-learning (DRL) algorithm and a DRL algorithm augmented with the goal-reducer (DRL+GR) on a four-room navigation task. Panel B shows a similar comparison for a robotic arm reaching task, using the Soft Actor-Critic (SAC) algorithm as the baseline. Panel C illustrates the performance of a standalone goal-reducer with a local policy in contrast to the performance of the DRL and DRL+GR algorithms.

This figure displays the results of comparing the goal-reducer model’s performance with human brain activity during a treasure-hunting task. Panel A illustrates the task design, while panels B show the different map configurations. Panels C and E present activation maps in the vmPFC and putamen regions, respectively, showing the model’s components’ similarity to human brain activity. Panels D and F present bar graphs summarizing the statistical results of the activation map comparisons.

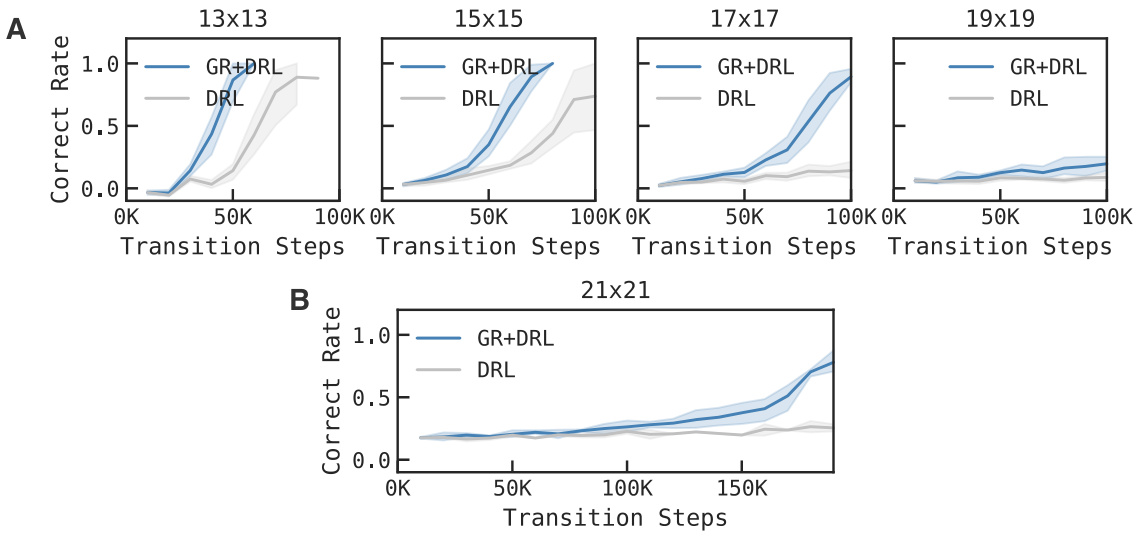
This figure shows the performance comparison between DRL (Deep Reinforcement Learning) and DRL+GR (DRL augmented with Goal Reducer) in a four-room navigation task with varying maze sizes (13x13, 15x15, 17x17, 19x19, 21x21). The x-axis represents the number of transition steps, and the y-axis shows the correct rate. The shaded areas represent the standard deviation across multiple runs. The results consistently demonstrate that DRL+GR outperforms DRL across all maze sizes, indicating the effectiveness of the goal-reducer in accelerating learning, even as task complexity increases.

This figure shows an example of the goal-reducer planning process. The red dot represents the agent’s current location. The dark green dot in the upper left corner represents the goal. The shadowed green circles represent the subgoals generated by the goal-reducer over time. The darker the green, the more subgoals are generated at that location. The figure shows the planning process at three different time steps: t=1, t=12, and t=26. At t=1, the agent is far from the goal and many subgoals are generated. At t=12, the agent is closer to the goal and fewer subgoals are generated. At t=26, the agent is very close to the goal and only a few subgoals are generated. This figure illustrates how the goal-reducer can effectively reduce the distance between the agent and the goal over time.

This figure demonstrates how a goal-reducer is integrated into a policy network (A). It also illustrates three types of subgoal sampling strategies (B): random sampling, trajectory sampling, and loop-removal sampling. Panel C shows how the filtration radius affects trajectory connectivity in loop-removal sampling, and panel D provides an example of a filtered trajectory compared to an original random walk in 3D space.
More on tables

This table lists the hyperparameters used for training the goal-reducer with Loop-removal sampling. The hyperparameters include the learning rate for the goal-reducer optimizer, batch size, and the maximum number of epochs.

This table lists the hyperparameters used for training the goal-reducer and DQL optimizer in Section A.3 of the paper. It includes the learning rates for both optimizers, batch size, and the maximum number of epochs.

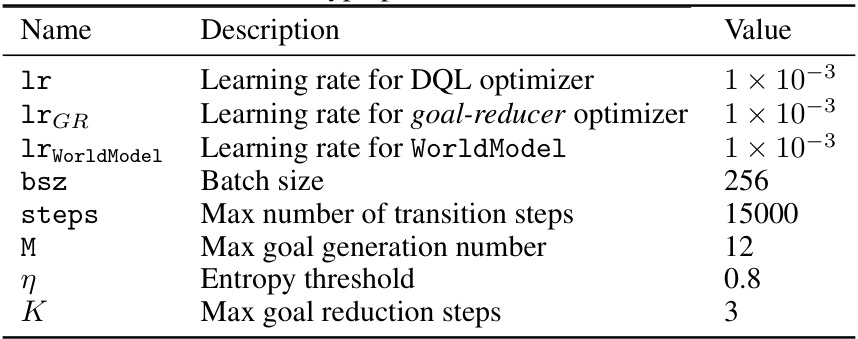
This table lists the hyperparameters used in Section A.4 of the paper, specifically for the goal-reducer in the standalone goal-reducer experiment. It includes learning rates for the DQL optimizer, the goal-reducer optimizer, and the ‘world model’, batch size, maximum number of epochs, maximum number of goal generations, entropy threshold, and maximum number of goal reduction steps.

This table lists the hyperparameters used in the goal-reducer fMRI data analysis, including learning rates for different optimizers, batch size, maximum transition steps, maximum goal generation and reduction steps, entropy threshold, etc.

This table presents the results of Representational Similarity Analysis (RSA) comparing the brain activity of human subjects with the activity patterns of different components in the goal-reducer agent. It shows which brain regions exhibit statistically significant correlations with various parts of the goal-reducer model (state representation, goal representation, subgoal generation, and actions) The table lists the coordinates of significant clusters, the corrected p-values, cluster sizes, and the corresponding brain regions based on an anatomical atlas.
Full paper#


